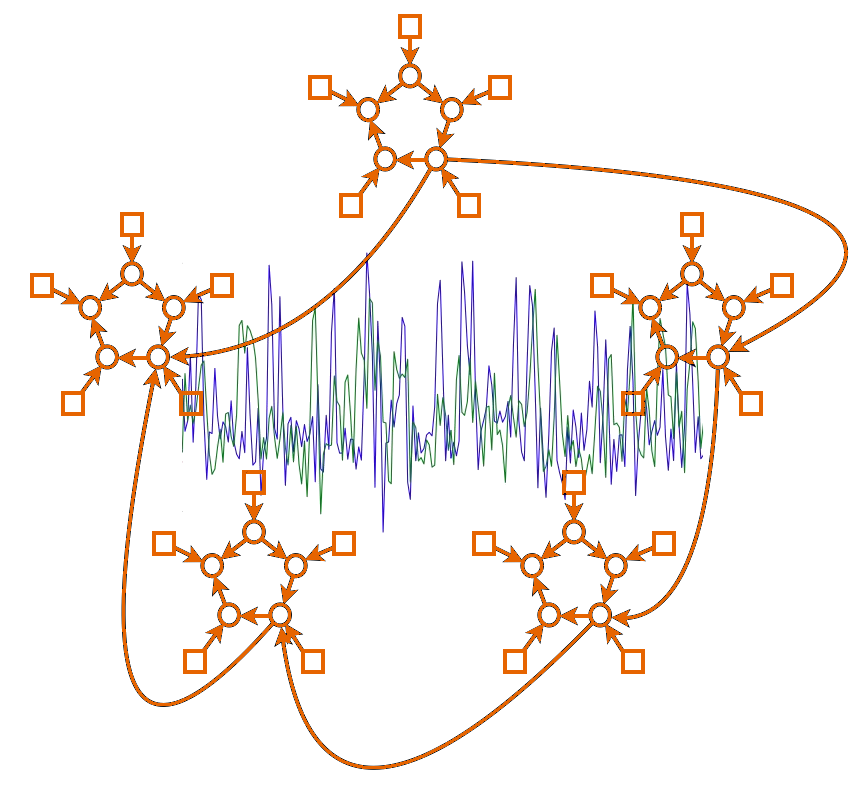
FSLNets
FSLNets is a set of Python scripts for carrying out basic network modelling from (typically FMRI) timeseries data.

The main thing you will feed into FSLNets network modelling is \(N\) timecourses from \(S\) subjects' datasets - i.e., timeseries from \(N\) network nodes. For display purposes you will also need the spatial maps associated with the nodes (one map per node). For example, a good way to get these timeseries and spatial maps is to use MELODIC group-ICA with a dimensionality of \(N\), to get the group-level spatial maps, and then use dual regression to generate \(S\) subject-specific versions of the \(N\) timecourses. Alternatively, you might have used a set of template images or ROIs from another study, to feed into the dual regression.
Now you are ready to compute a network matrix for each subject, which in general will be an \(N\times N\) matrix of connection strengths. The simplest and most common approach is just to use "full" correlation, giving an \(N\times N\) matrix of correlation coefficients. Or, you might want to estimate the partial correlation matrix, which should do a better job of only estimating the direct network connections than the full correlation does. Once you have estimated a network matrix for each subject, you can then test these matrices across subjects, for example, testing each matrix element for a two-group subject difference, or feeding the whole matrices into multivariate discriminant analysis.
Example usage
You can use FSLNets from the fslpython or fslipython Python interpreter which is installed as part of FSL.
If you are using fslipython, enable interactive Matplotlib plotting by typing:
Then import the fsl.nets package:
You can use the nets.load function to load time series from a dual regression output directory:
Tip
The FSLNets functions are all well documented - for example, type help(nets.load) (or ?nets.load if you are using fslipython) to view the documentation for the nets.load function.
Or you can use the nets.load_from_images function, which will run the first stage of dual regression for you, to generate time series from a set of 4D functional images, and will generate node thumbnails from the MELODIC output:
from glob import glob

subjdata = glob('subject_*/filtered_func_data_standard.nii.gz')
melic    = 'groupICA/melodic_IC.nii.gz'
ts       = nets.load_from_images(melic, subjdata, tr=0.72)
Use the nets.plot_spectra and nets.plot_timeseries functions to view node time series/power spectra for quality-control purposes:
You can use the nets.clean function to regress out the time courses of any "bad" nodes, i.e. those which do not represent neuronal signal:
goodnodes = [0,  1,  2,  4,  5,  6,  7,  8, 10, 11,
             12, 16, 17, 18, 19, 20, 21, 22, 24, 25,
             26, 27, 28, 29, 30, 31, 32, 33, 34, 35,
             36, 37, 39, 41, 42, 46, 47, 48, 49, 51,
             52, 54, 55, 56, 57, 58, 60, 61, 63, 64,
             65, 69, 70, 71, 72, 73, 76, 79, 80, 85,
             86, 92, 96]

nets.clean(ts, goodnodes, aggressive=True)
Calculate node-to-node connectivity matrices for each of your subjects with a selection of different estimation methods using the nets.netmats function:
Calculate the mean connectivity across a group of subjects with the nets.groupmean function:
Znet_F, Mnet_F = nets.groupmean(ts,
                                Fnetmats,
                                plot=False)
Znet_P, Mnet_P = nets.groupmean(ts,
                                Pnetmats,
                                plot=True,
                                title='Partial correlation')
Perform hierarchical clustering on a correlation matrix using nets.plot_hierarchy:
nets.plot_hierarchy(ts, Znet_F, Znet_P,
                    lowlabel='Full correlations',
                    highlabel='Partial correlations')
Display the hierarchical clustering interactively in a web browser with nets.web:
Perform group statistics using randomise via the nets.glm function:
Plot group connectivity distributions for the most significant edges from one of your contrasts:
Train a scikit-learn classifier on edge strengths to differentiate your groups:
MATLAB version
The original version of FSLNets was written in MATLAB - it was rewritten in Python to make it more widely available and easier to install. The MATLAB version is still available though, and can be downloaded here.
Requirements
- FSL
- MATLAB or Octave:
- For MATLAB, you will need the official MATLAB toolboxes:
- Statistics (you must have this one)
- Bioinformatics (if you want to use MATLAB's SVM)
- Signal Processing (if you want to see timeseries spectra)
- For Octave, you will need Octave version 3.8.0 or later, as well as toolboxes:
- control (v2.6.2 or greater)
- general (v1.3.4 or greater)
- signal (v1.3.0 or greater)
- statistics (v1.2.3 or greater)
- LIBSVM (setup for MATLAB or Octave - if you want to use the LIBSVM implementation of SVM for netmat-based classification)
- L1precision - free third-party MATLAB toolbox (to estimate L1-norm regularised partial correlation matrices)
- Pairwise causal - free third-party MATLAB toolbox (if you want to look at causal directionalities)
Installation
-
Unpack FSLNets with
tar xvfz fslnets.tar.gz(ortar xvf fslnets.tarif your browser has already uncompressed the file). -
See the top of the file
nets_examples.m, which you can edit to point to the paths of the various additional toolboxes listed above.
Usage
Take a copy ofnets_examples.m (for example cp nets_examples.m my_nets.m) and edit this new file with your own settings. To run inside MATLAB, just copy individual lines, one at a time, into MATLAB from your new file, or, once it is ready, just type my_nets in MATLAB.
The file nets_examples.m is fairly well documented, with each stage of the analysis hopefully fairly clear and easy.