Frequently asked questions about TOPUP
How do I know what to put into my --acqp/--datain text file?
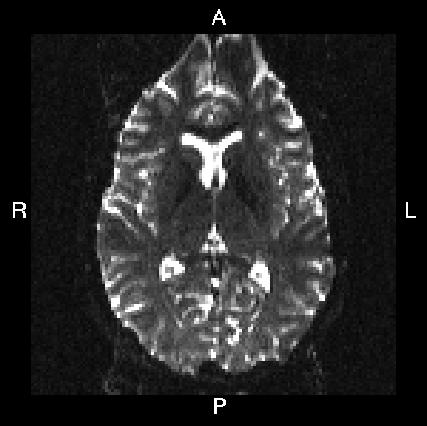
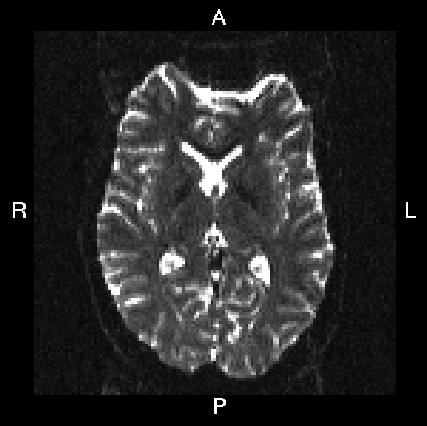
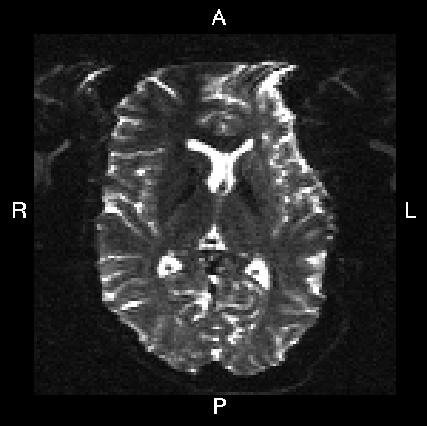
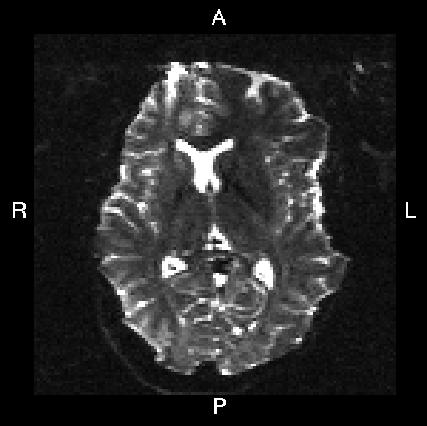
Below you see four examples of images acquired with different phase encoding. Below the images you see what you would find in the PDF protocol generated on a Siemens scanner for these acquisitions. Unfortunately I don't have enough experience of other scanner manufacturers to know where to find the information from those.
If you are uncertain about how to create your own --acqp file I suggest you get your scanner protocol, load your images into FSLVIEW and then find which of the images below that looks most like then one you have. When you have done that compare the "Phase enc." entry below that image with that in your protocol. When you are happy that you have found the right column you can use the three first values from the vector below the image.
Finally look up the "Echo spacing" and "EPI factor" entries in your Siemens protocol PDF and calculate the fourth column, the total readout time, from the formula
where \(S_E\) is the echo spacing in ms and \(F_{EPI}\) is the EPI factor.
| What you see in FSLeyes |
 |
 |
 |
 |
|---|---|---|---|---|
| In Siemens protocol | Phase enc. dir P >> A Echo spacing 0.75 ms EPI factor 128 |
Phase enc. dir A >> P Echo spacing 0.75 ms EPI factor 128 |
Phase enc. dir R >> L Echo spacing 0.96 ms EPI factor 128 |
Phase enc. dir L >> R Echo spacing 0.96 ms EPI factor 128 |
| In --acqp file | 0 1 0 0.095 | 0 -1 0 0.095 | 1 0 0 0.122 | -1 0 0 0.122 |
Another option is if you are, which you probably are, using dcm2niix to convert your DICOM images to nifti. In that case you will have a .json "sidecar" file associated with your images. That sidecar is likely (depends a little on vendor) to have a field named TotalReadoutTime which will give you the number that you need to put in the fourth column.
What if I have some old data where I am unable to find the total readout time?
What topup "really" estimates is the displacement field that when applied to the two images in the pair makes them as similar as possible. The purpose of the total readout time is simply to allow topup to rescale that displacement field to Hz. All "topup aware" software (i.e. topup, applytopup and eddy) performs the scaling back and forth between displacement and Hz in exactly the same way. That means that any error in the scaling (because of using an incorrected total readout time) will cancel out and the correction (which is what we are really interested in) will still be correct. It is really only if one wants to use the estimated Hz-fieldmap with a different software that it becomes critical to get the total readout time correct.
Hence, if you cannot find the "true" total readout time and you plan use the output only with eddy or applytopup we recommend setting it to some arbitrary but reasonable value (we use 0.05).
Do I have to have an even number of slices to use TOPUP?
No, you don't.
There was a time when we recommended having and even number of slices, even going so far as to recommend deleting or duplicating the ultimate slice in either direction when your data had an odd number of slices. That was clearly not ideal, and we apologise for that. It became clear just how bad an idea that was when eddy became capable of doing slice-to-volume motion correction, and eddy needed to know the exact multi-band structure of the data.
Instead we recommend using different configuration files depending on if one has odd or even numbers of slices as described here
What if the subject moves between the two acquisitions?
With topup that is not a huge problem as it has an internal movement model which allows it to simultaneously estimate the off-resonance field and any movement between the two volumes. This is in contrast to any other "reverse PE-direction" method that we are aware of. We believe this to be crucially important. Without a movement model any difference between the two volumes will have to be explained by the off-resonance field, which can therefore end up being very poorly estimated in the presence of subject movement. An added danger is that the "off-resonance only" model is sufficiently "expressive" that it can result in very realistic looking, albeit completely nonsense, corrected images. It is therefore difficult to spot the problem even if eyeballing the images.
|
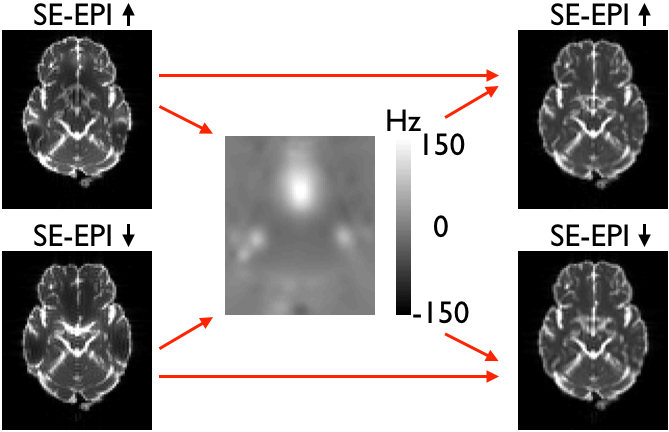
| In the top row is a pair of images with Ant->Post (left panel) and Post->Ant (middle panel) PE-encoding, and the resulting field estimated by TOPUP. In the second row we can see the same Ant->Post image (left panel), but now the subject has deliberately moved prior to the acquisition of the Post->Ant image. Despite that, thanks to TOPUP's internal movement model, the field has been accurately estimated. It can be seen in the lower right panel that there is very little difference to that in the upper right panel. |
|
| This figure shows the results from running TOPUP with (top row) and without (bottom row) the internal movement model. The left column shows the estimated field and the right column shows the corrected image. The pair that was used to estimate the field can be seen in the first two columns of the bottom row in the figure above. The image that was corrected is that from the middle column, bottom row in the figure above. It can be seen that without the movement model the field is very poorly estimated. Perhaps most worrying is that while the corrected image is "wrong" (compare the top and bottom row of the right column) it doesn't look "obviously wrong", and someone inspecting the corrected images as part of quality assurance is unlikely to detect any problem. |
However, even though topup is able to deal with subject movement much more gracefully than methods without a movement model, there are still issues to be aware of. A large out-of-plane rotation will change the field in a way that is not consistent with the field being constant in the space of the object. So when pairing the two images it is no longer true that there is a single field that can explain the distortions in both images. That is a second order effect though, and in general the estimated field is a useful representation even in the presence of large such rotations.
Can I use a fieldmap from topup to correct fMRI (GE-EPI) data?
Yes, there is no principal difference between a fieldmap estimated using a pair of gradient echo images with different echo times (i.e. "traditional" fieldmaps as processed by fsl_prepare_fieldmap, prelude and fugue. The resulting fieldmaps may superficially have quite a different appearance, but this is mainly due to different strategies for "guesstimating" the field outside of the object (where there is no signal that we can derive it from). Inside the object, where it matters, the fields should be very similar.
Unfortunately this doesn't mean that they are completely interchangeable. The way that the fugue suite of tools "guesstimate" the field outside of the object means that the resulting displacement field is non-invertible. Hence, it can be used to transform distorted images to non-distorted images, but it cannot transform images the other way. This is a problem for eddy, which hinges on being able to go back and forth between "observed space" and "undistorted space".
Therefore one can use fieldmaps estimated using topup in FEAT, but one cannot (easily) use fieldmaps prepared with the fugue suite with eddy or applytopup. The easiest way to create the files needed for FEAT is to use the --featout parameter. Adding --featout='my_fname' to the topup command line will produce two output files named 'my_fname'_mag.nii.gz and 'my_fname'_radmap.nii.gz that can be directly used in FEAT.
Can I use topup to estimate the field from two GE-EPI images with opposing PE-direction?
No, there are strong indications that one shouldn't do that. Certainly not without validating it very carefully. The model underlying topup assumes that the two images are identical except with respect to displacements going in different (typically opposing) directions. However, with gradient-echo(GE)-EPI data there is also signal modulation (mostly dropout, but also increases in signal) in the images. This is caused by local gradients in the field, where the mechanisms of the signal modulation are different for gradients in the frequency-encode, phase-encode and slice-select directions respectively. Importantly, each of the three mechanisms depend on the polarity of the phase-encoding, i.e. the signal modulation is different for the two images.
|
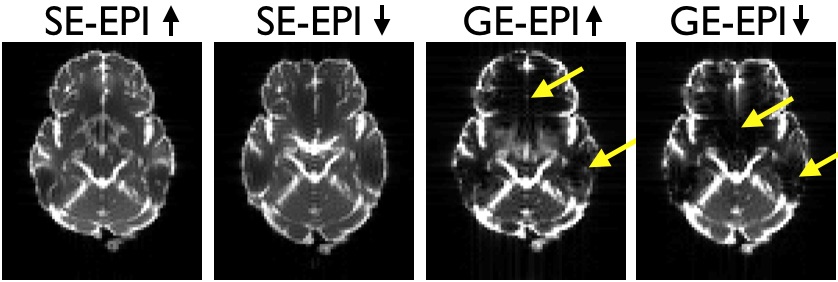
| Pairs of SE- and GE-EPI images acquired with opposing phase-encode directions. Note how the distortions are the same as evidenced by the similar shape. But that in the GE-EPI images there are also signal dropout that differ between the two image. |
This means that the model underlying topup is not valid for these data, and the consequence will be that topup will attempt to "explain" the observed differnces due to signal modulation as being caused by distortions. It can do a surprisingly good job at that, producing two "corrected" images that look very similar. But that is potentially at the cost of an estimated field that is far from the true field, and "corrected" images that are potentially even worse distorted than to start with. Below is a comparison between a field estimated from a pair of Spin-Echo(SE)-EPI images and from a pair of GE-EPI images. The images have been simulated using the physics based MR-simulator POSSUM, so the truth is known. As can be seen the field estimated from the GE-EPI pair is almost the negation of the true field. This means of course that the "corrected" images are worse than the original images.
 |
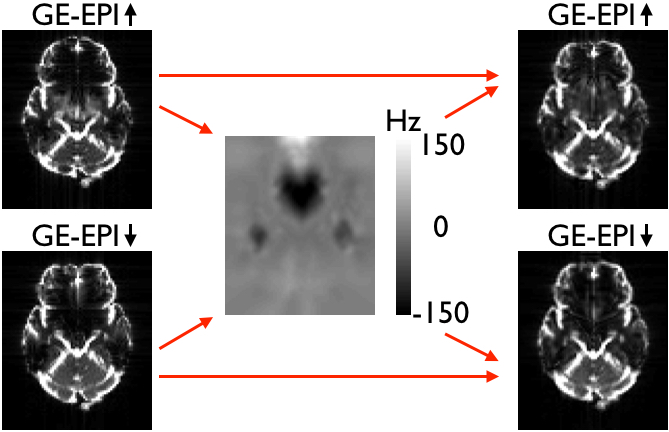 |
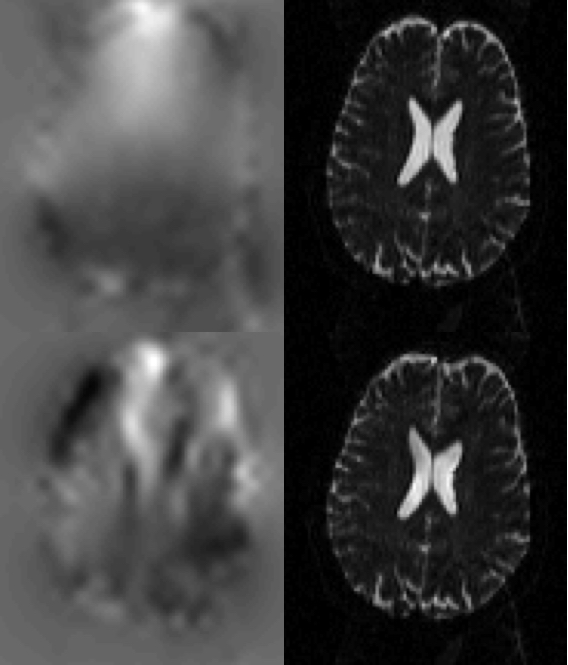
| Both panels show the two original (distorted) images on the left, the field estimated (by topup) to minimise the difference between the corrected images in the middle and the two corrected images on the right. The left panel shows SE-EPI images (e.g. diffusion b0-images) and the right panel shows GE-EPI images (e.g. fMRI images). Note that topup appears to have done a good job of correcting for distortions in both cases, but that the estimated field for the GE-EPI data is almost the negation of the true field. | |
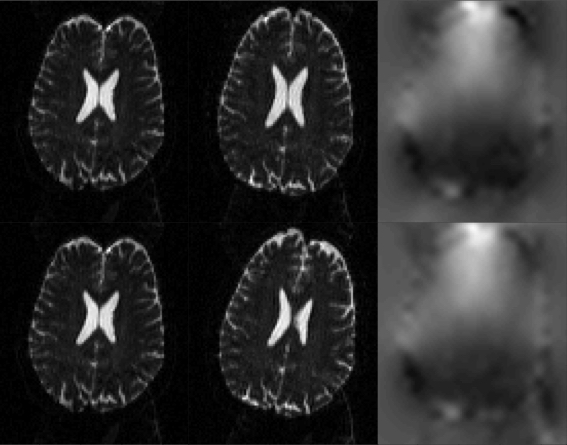
If instead using the true field for the GE-EPI images one can see below that the corrected images also look good. But looking closely one can see that in the areas of severe signal modulation it doesn't do quite as good a job (of matching the intensities) as the "faulty" field. Hence it is easy to see why topup would find the "faulty" field.
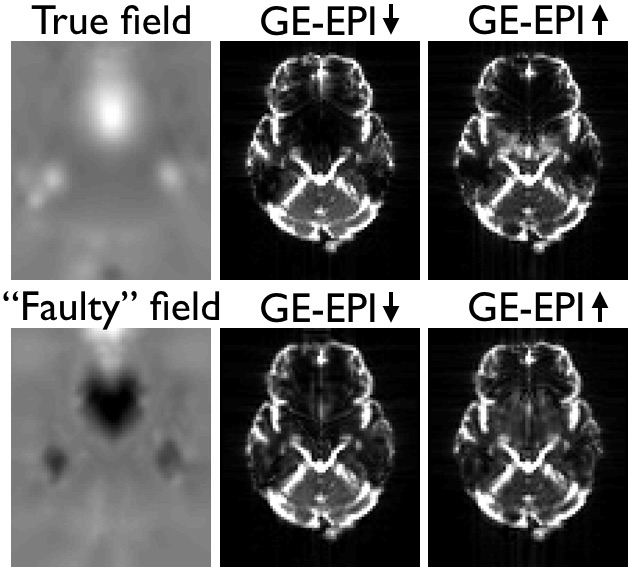 |
| The top row shows the true field and the resulting corrected GE-EPI images. Note how the outlines of the brains look similar, indicating that the distortion correction has been successful. Note also that the intensities inside the brain are quite different, with the A->P image having more signal dropout posterior of the peak in the off-resonance field while in the P->A image it is mostly anterior of the peak. This indicates that the signal modulation is dominated by the gradient (in the off-resonance field) along the PE-direction, which leads to a shift in echo time. The bottom row shows the "faulty" field, that which was estimated from the GE-EPI image pair, along with the resulting corrected images. Note how topup has "successfully" managed to reduce the difference in signal modulation, leading to an estimated field that is vastly different to the truth. |