Viewing NIfTI-MRS Files
Loading the Plugin
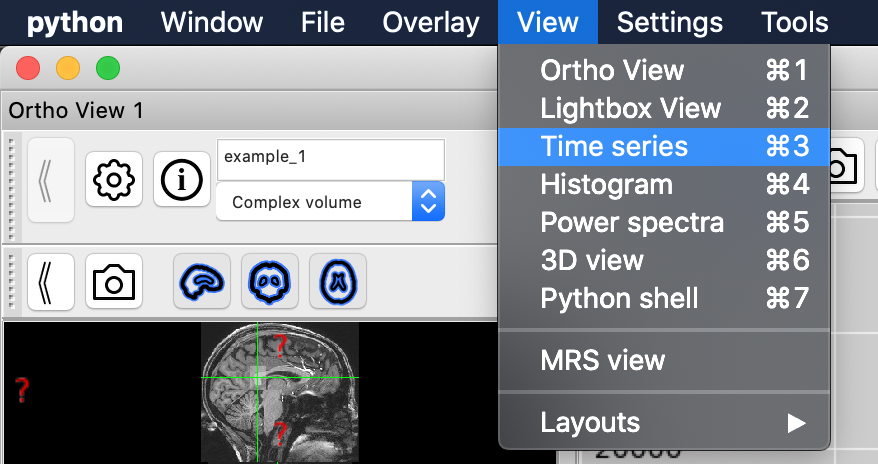
To enable the MRS components in FSLeyes, select the MRS layout from the Layouts submenu of the View menu.

Alternatively start fsleyes with the -smrs flag, or the –showAllPlugins flag.
fsleyes -smrs …
fsleyes –showAllPlugins …
Any of the above options will enable the MRS View option in the View menu, and the Load MRSI Fit in the Tools menu.
The MRS View
NIfTI-MRS files are handled natively as complex NIfTI files by FSLeyes. This plugin introduces a dedicated viewer for MRS and the NIfTI-MRS format which aims to ease the viewing of such data and introduces additional features not available in the base version.
Start the dedicated MRS View by selecting MRS view in the View menu.

This will open a dedicated MRS plotting panel in FSLeyes.
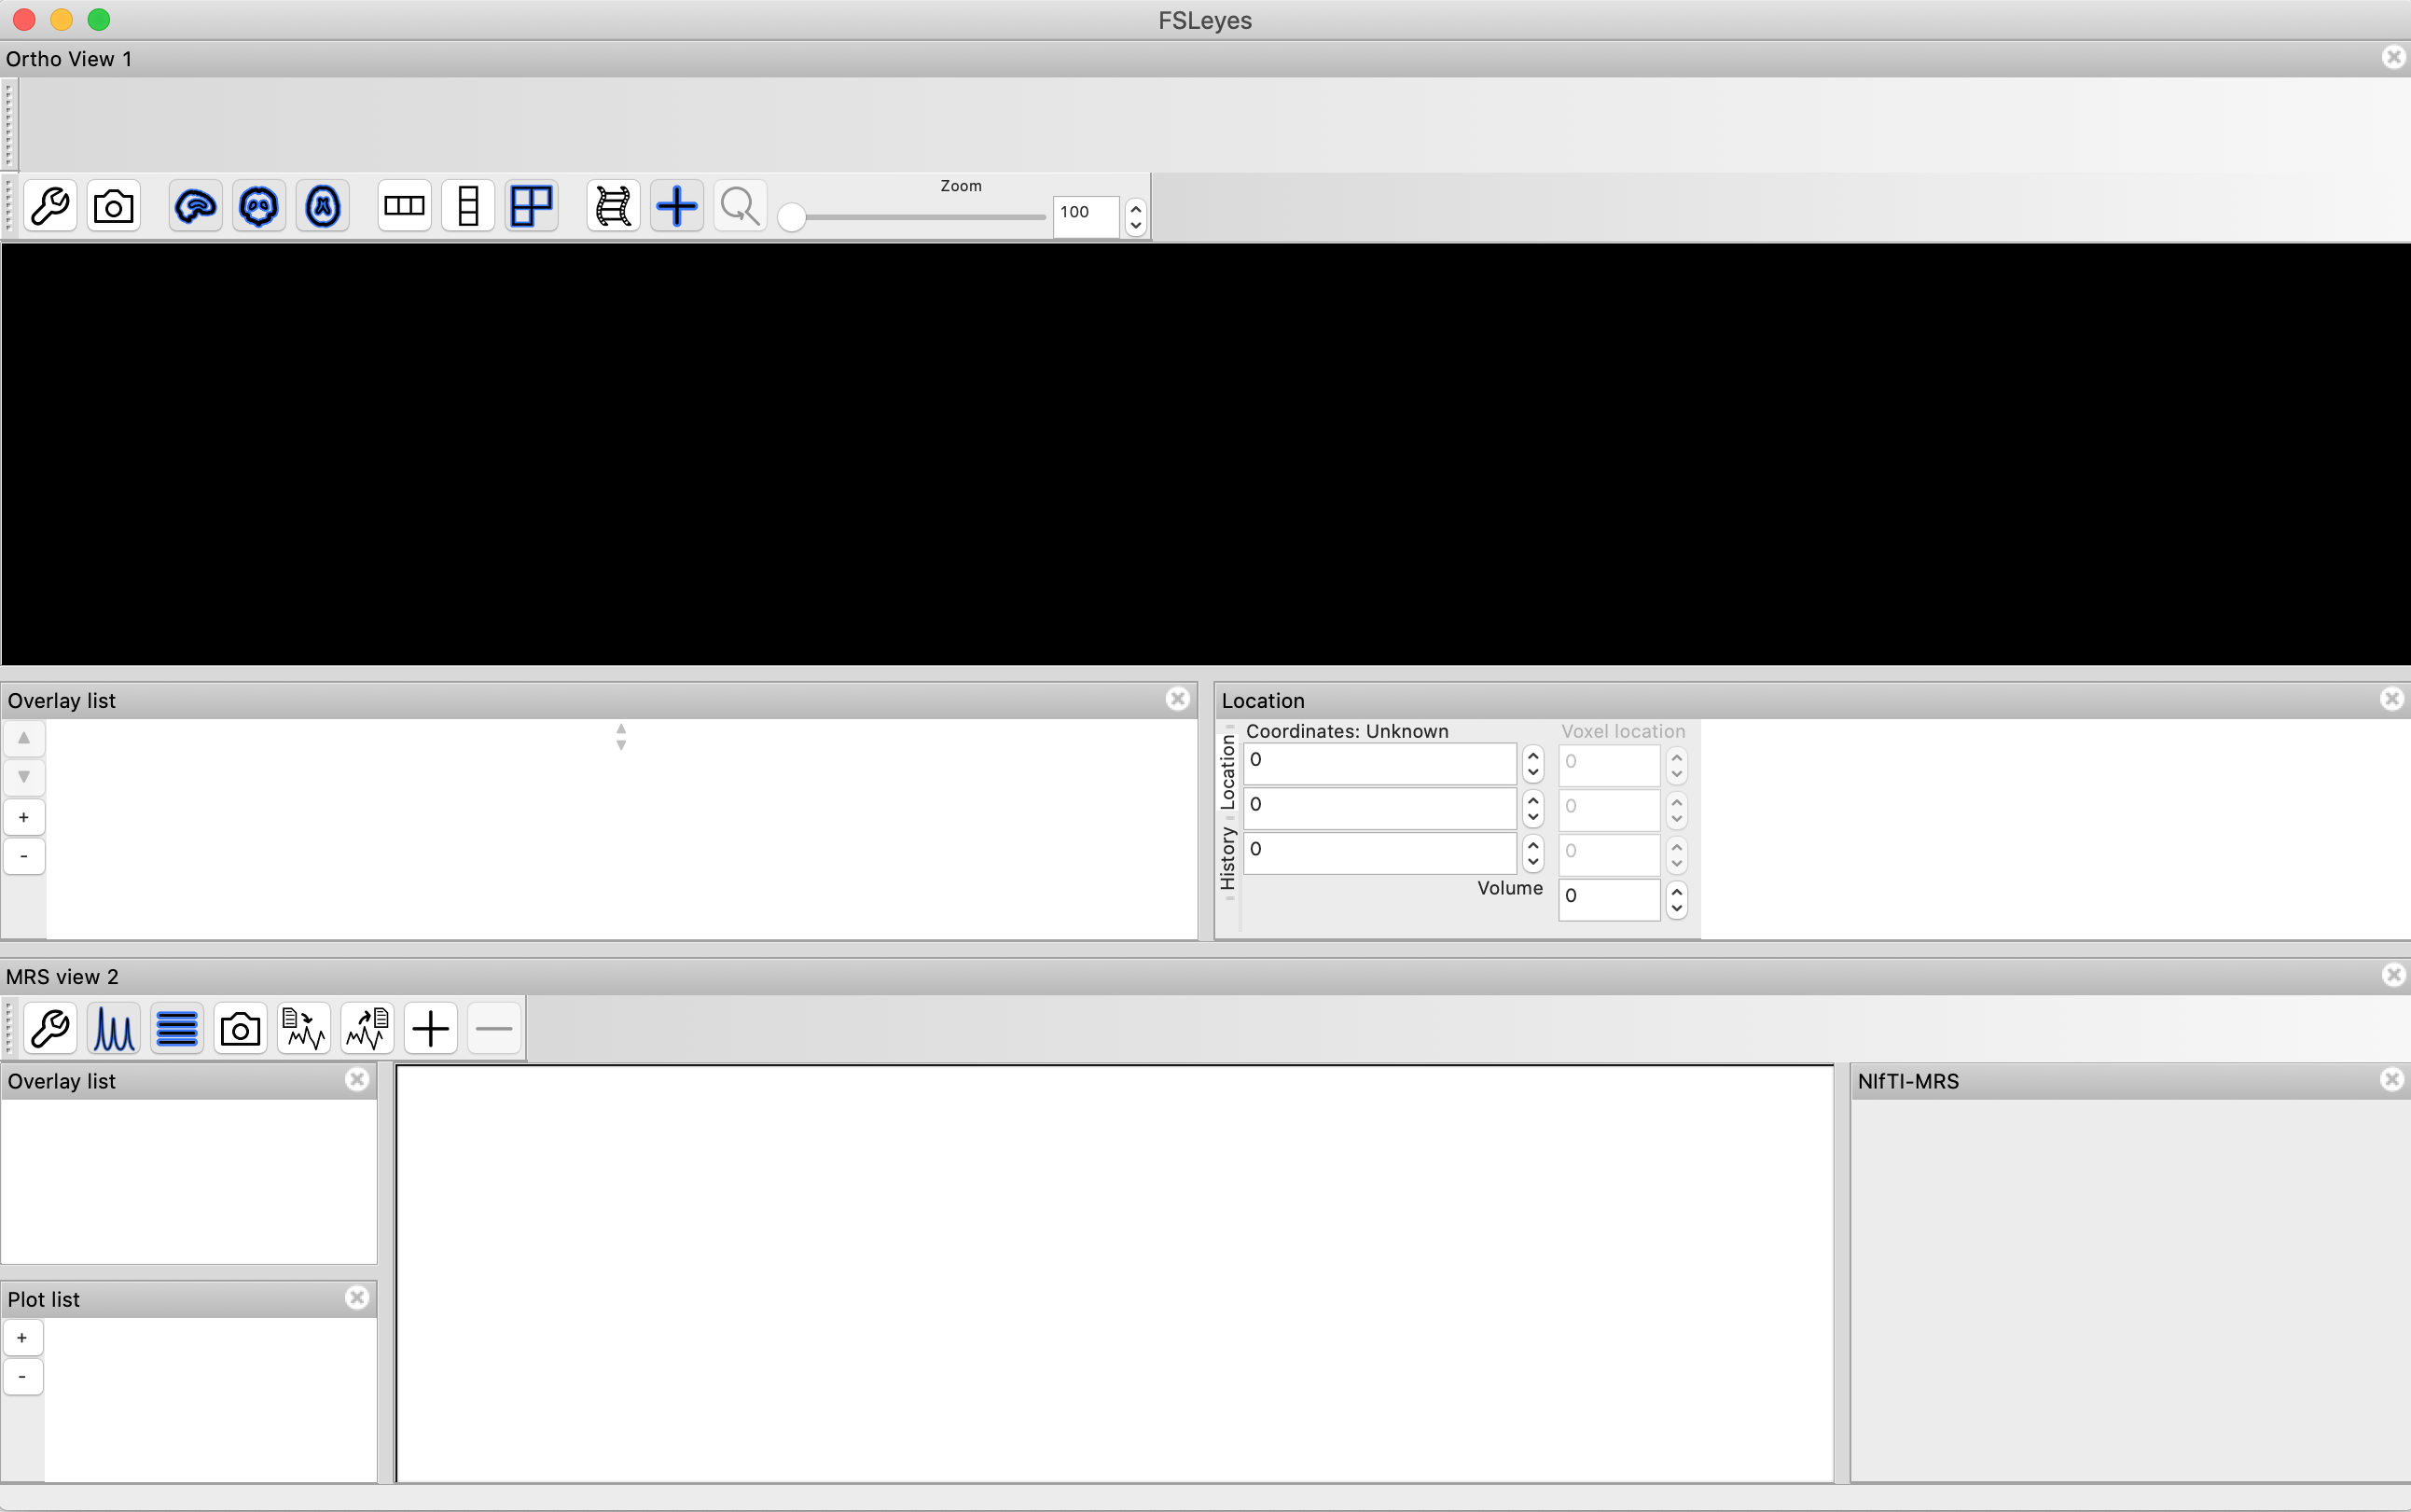
A spectrum will be displayed when activated in the overlay list and the correct location is selected in the orthographic view.
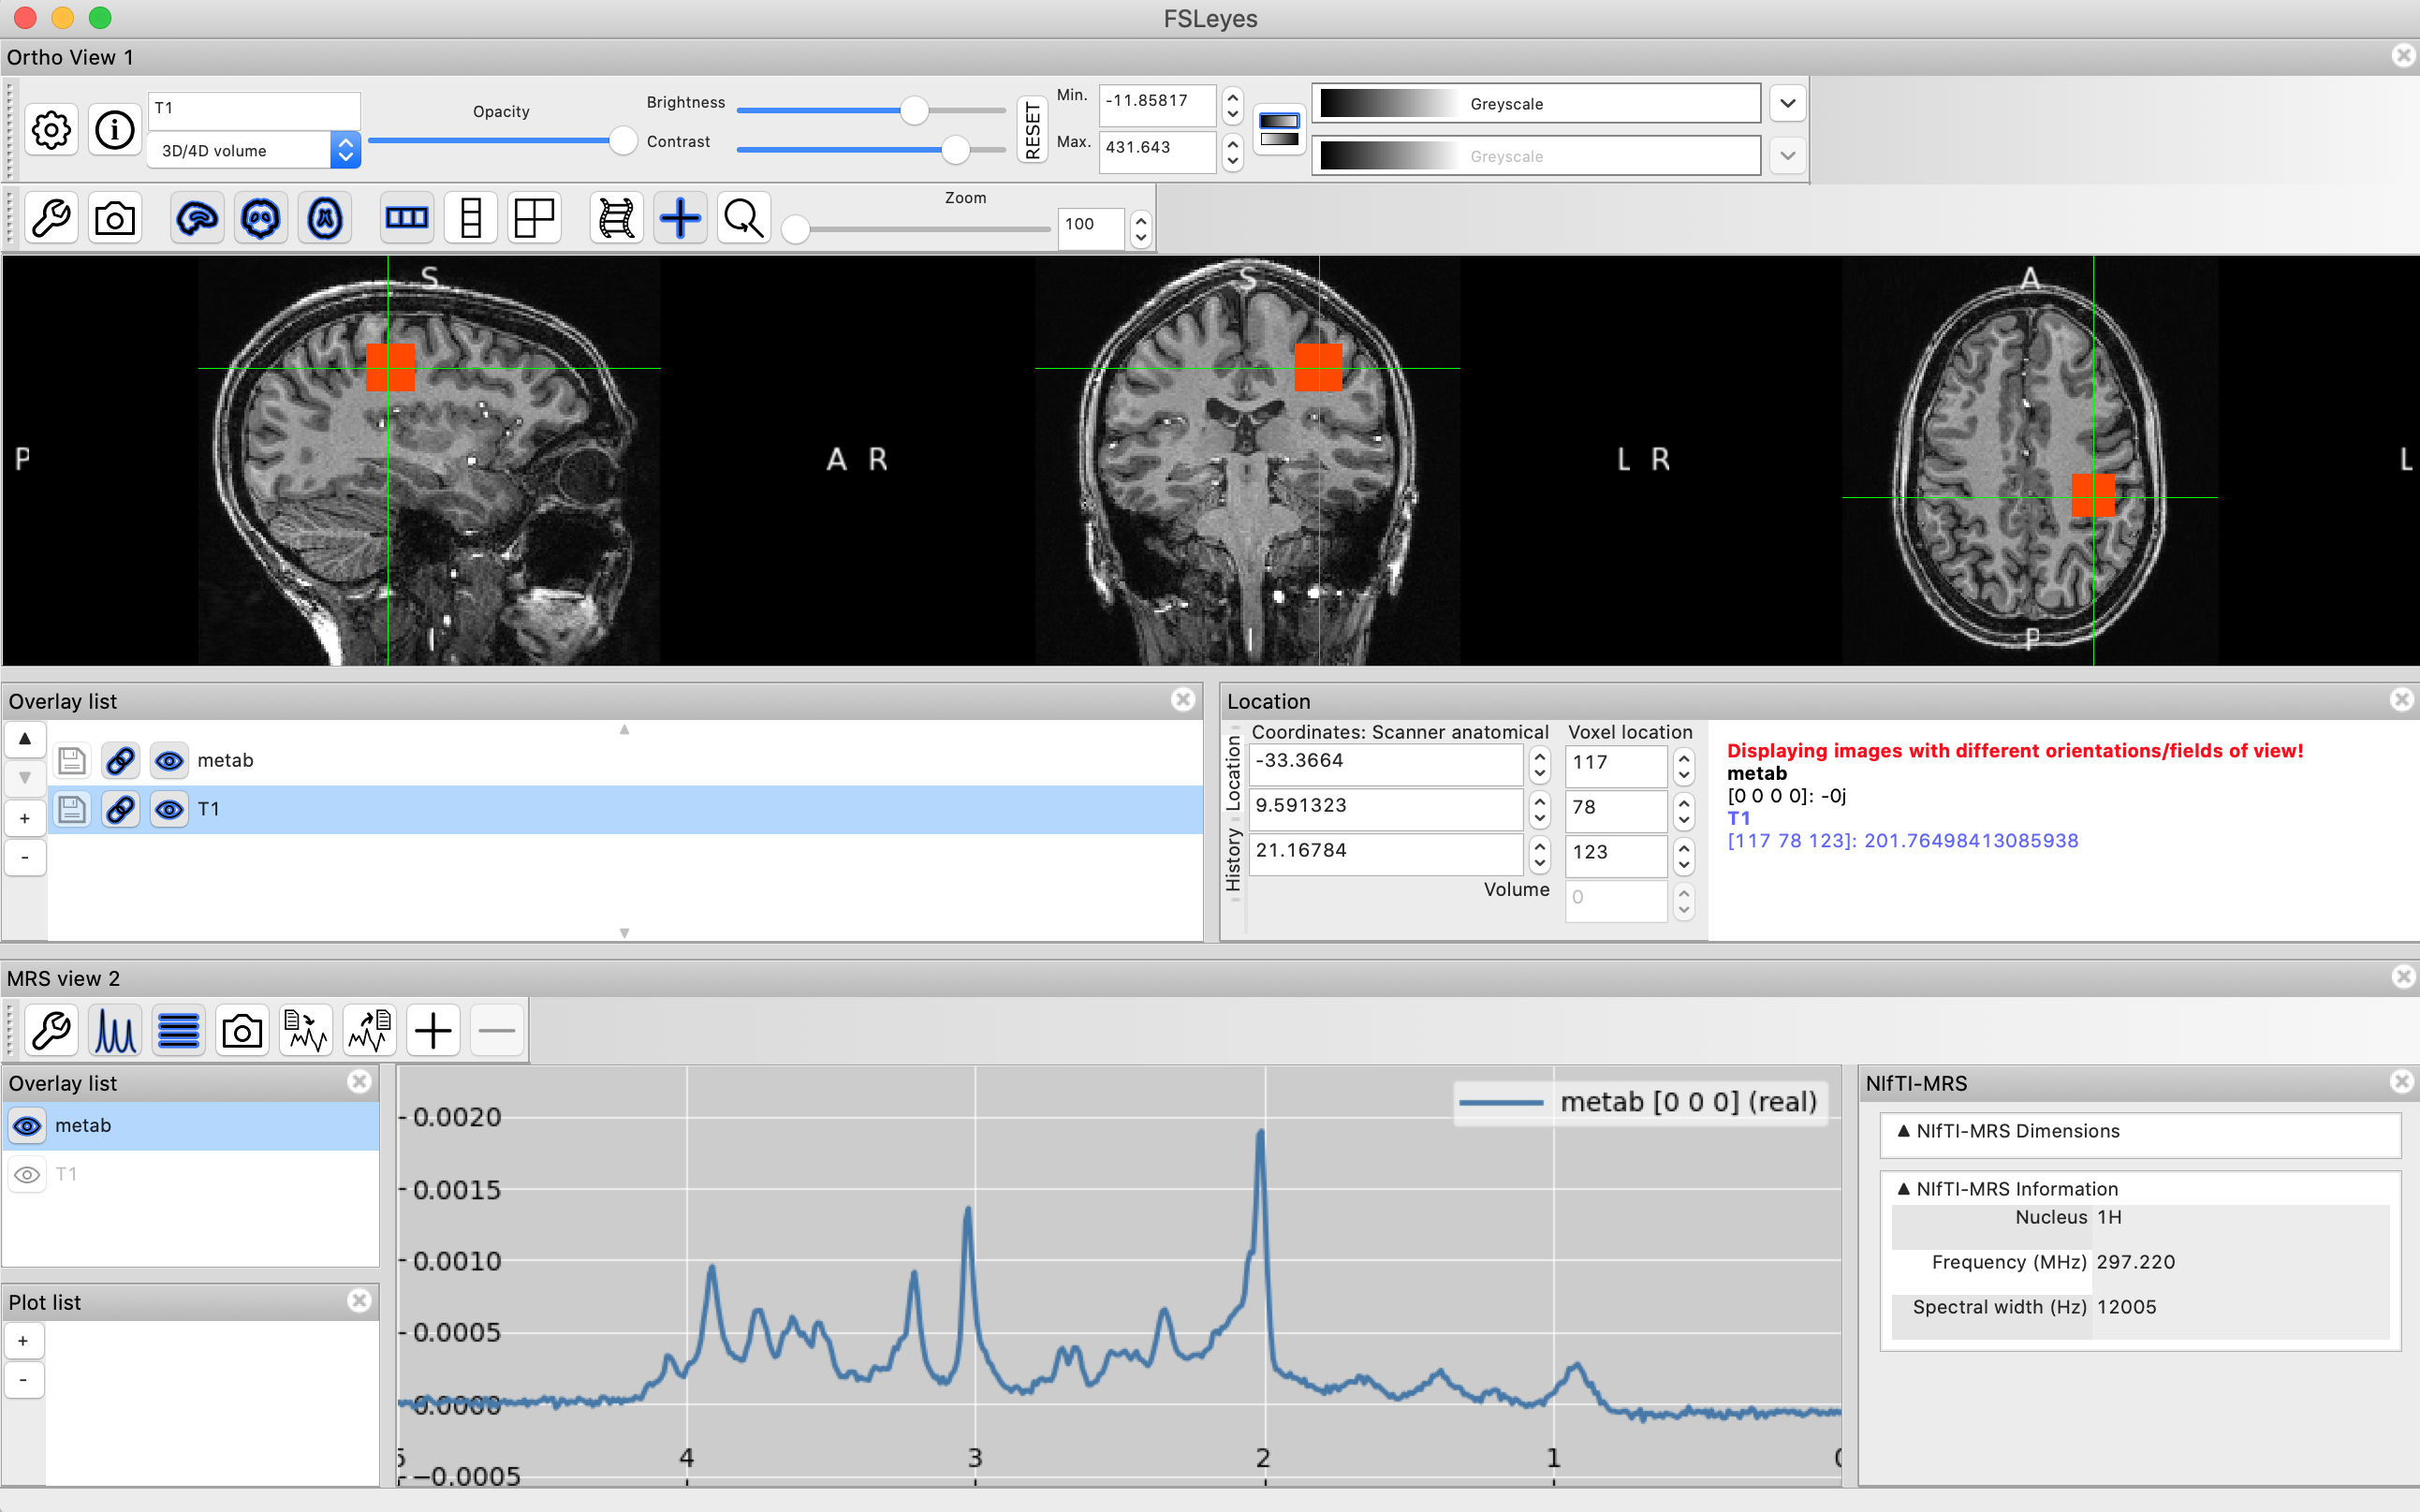
In the MRS View spectra should appear correctly orientated and with the correct chemical shift scale.
Default MRS Layout
A built in MRS layout can be loaded from the command line using:
fsleyes -smrs …
If this is done with data specified, e.g.
fsleyes -smrs T1.nii.gz metab.nii.gz
then a view like this should be generated.
Note that the overlay ‘metab’ has been activated in the overlay list and the voxel location selected in the ortho panel.
Viewing Different Projections and The MRS Control Panel
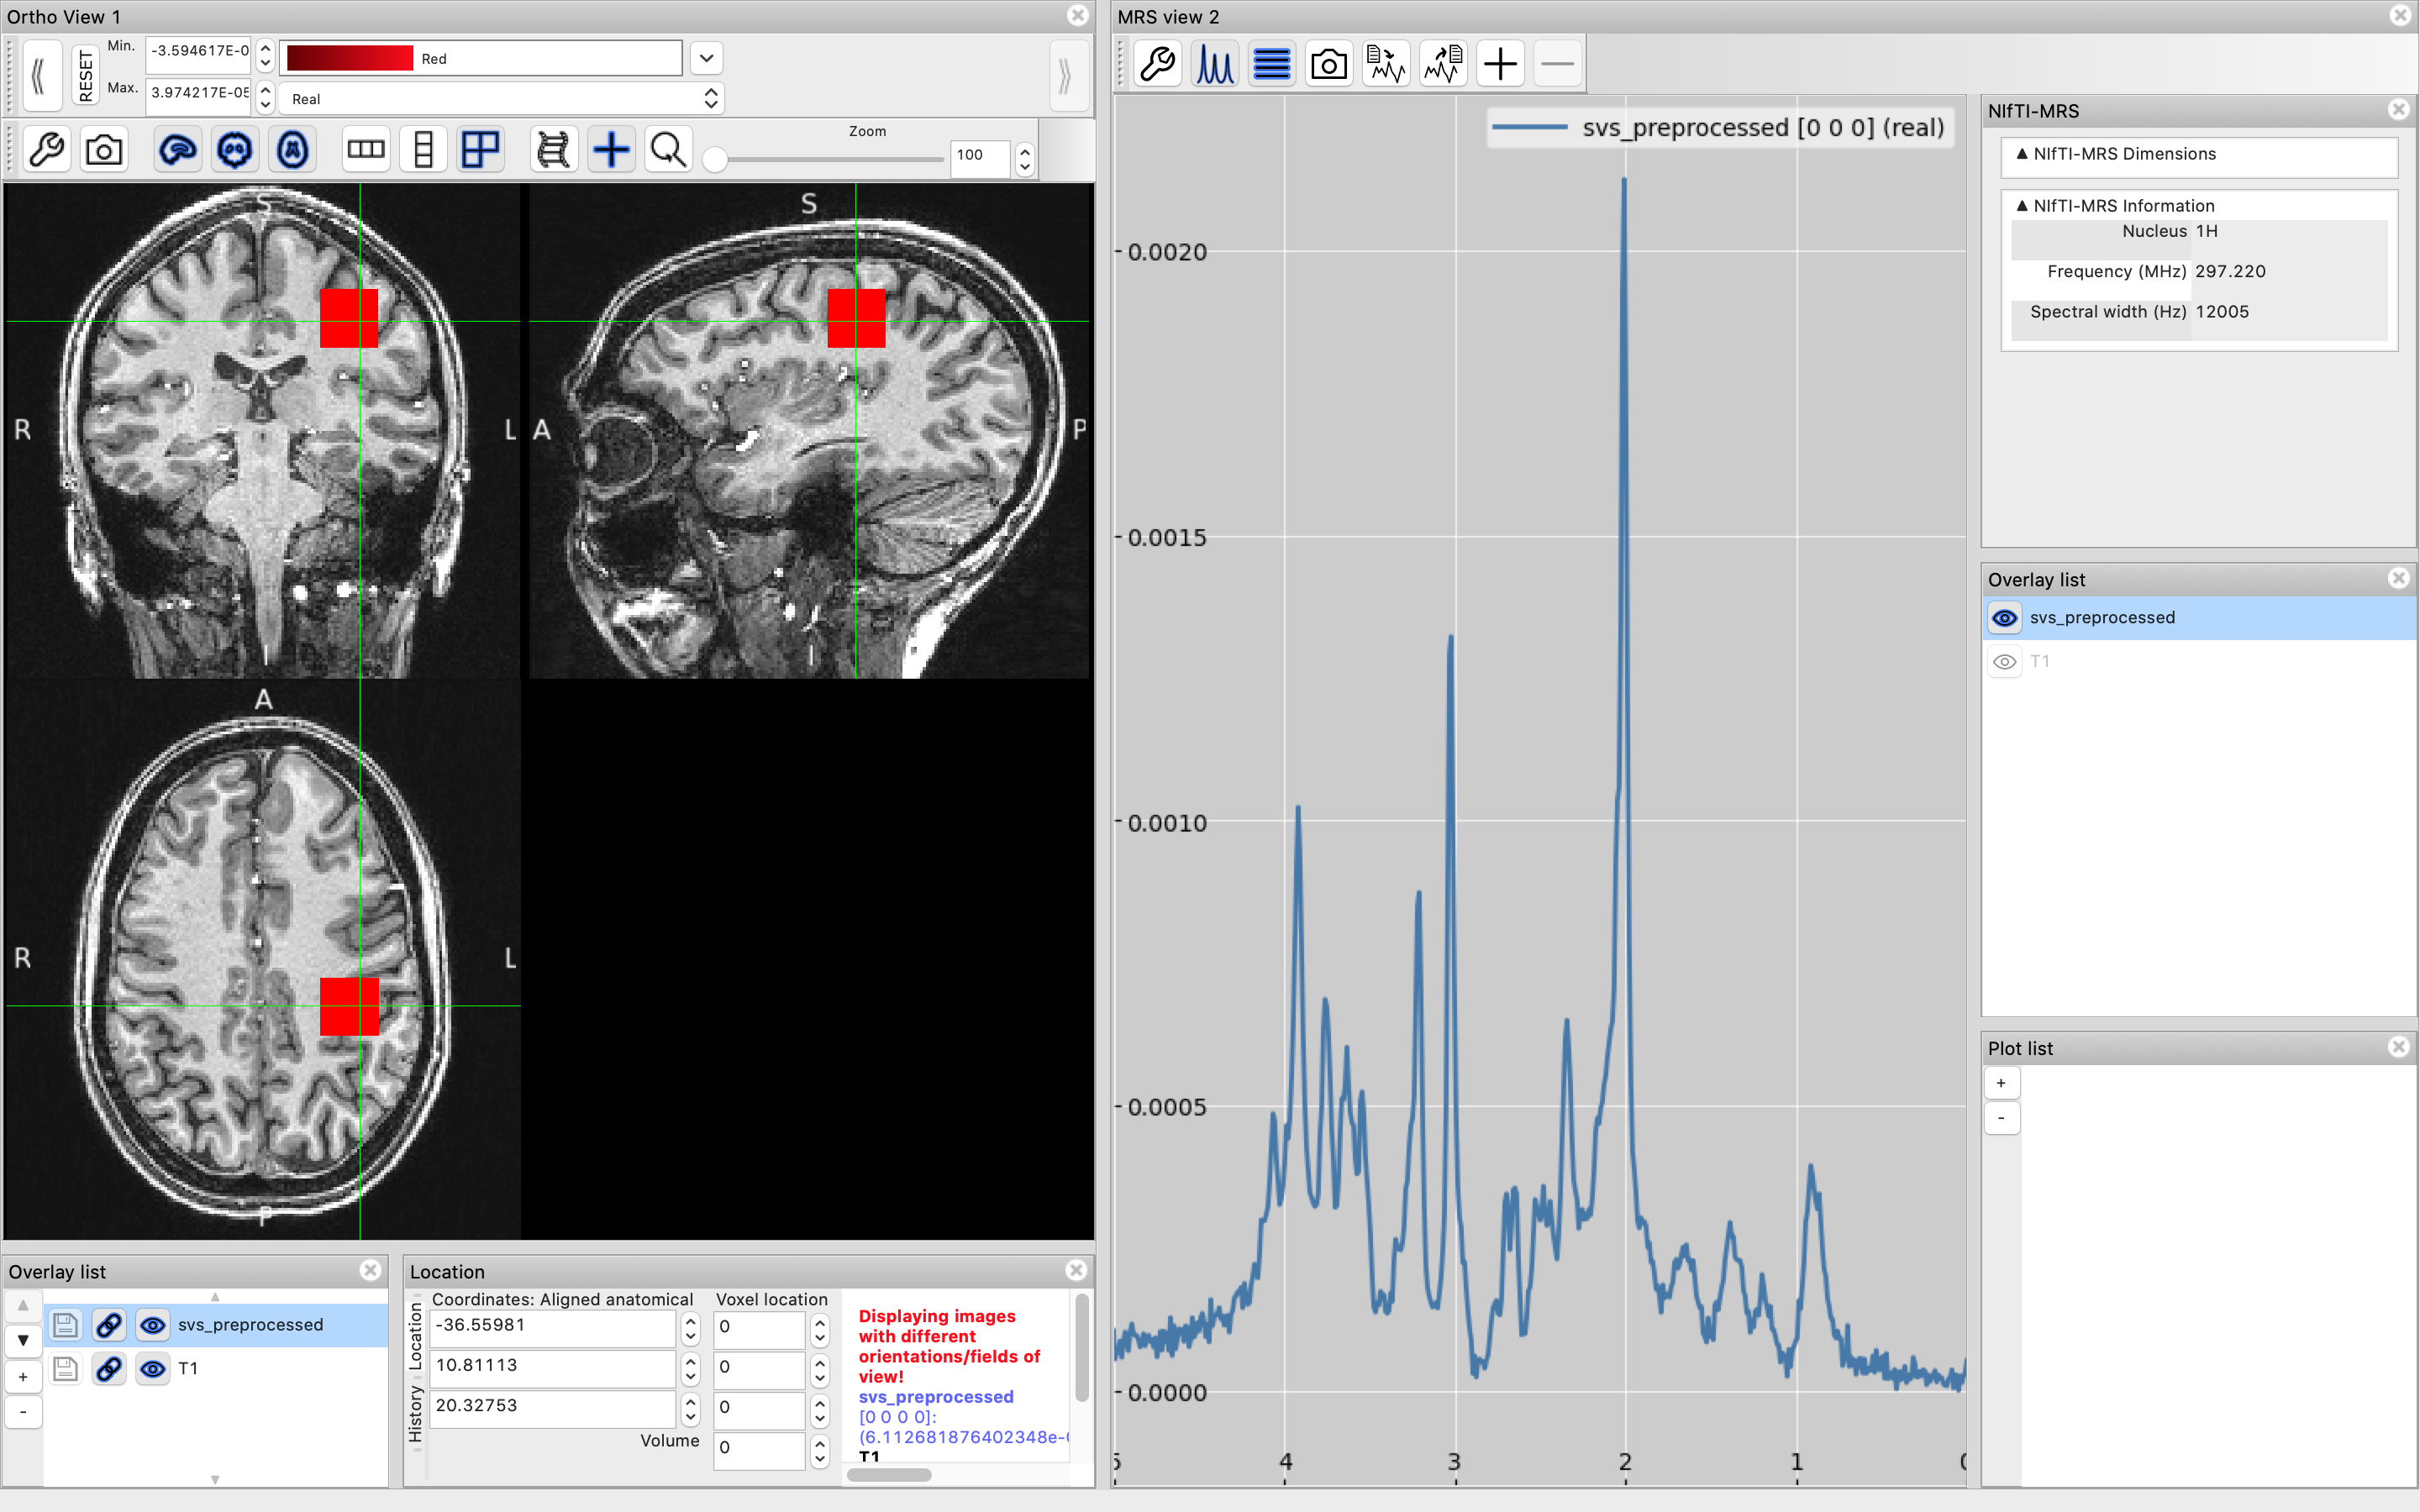
By default the real components of any spectra are displayed.
A control panel for the MRS View
(open with ![]() , or by the Settings -> MRS {N} -> MRS control menu option)
allows the user to select other views (imaginary, magnitude, or phase).
Multiple projections can be viewed simultaneously.
Note, since version 0.1.3 the selection of projections is linked across all spectra in the panel.
, or by the Settings -> MRS {N} -> MRS control menu option)
allows the user to select other views (imaginary, magnitude, or phase).
Multiple projections can be viewed simultaneously.
Note, since version 0.1.3 the selection of projections is linked across all spectra in the panel.

Phasing (and apodizing) the spectra can be applied in this menu, for instructions see Manipulating Spectra.
The line colour, line type and plot background can also be customised in the control panel by expanding the General and specific plot settings sections.

Viewing higher dimensions in NIfTI-MRS
NIfTI-MRS has the ability to display data contained in the higher (5th, 6th, and 7th) dimensions of a NIfTI file. NIfTI-MRS uses these dimensions to store things like uncombined coils, repeated averages (dynamics), or editing sub-spectra.
This functionality is provided using the NIfTI-MRS panel. This opens by default with the MRS View, but can also be accessed using the ![]() icon or through the menus.
icon or through the menus.

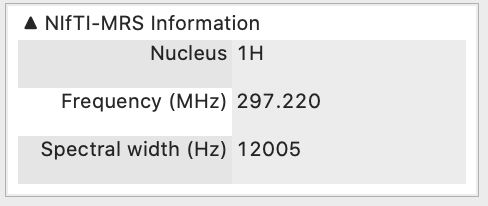
For all data this panel provides basic information about the spectrum currently selected in the overlay list.
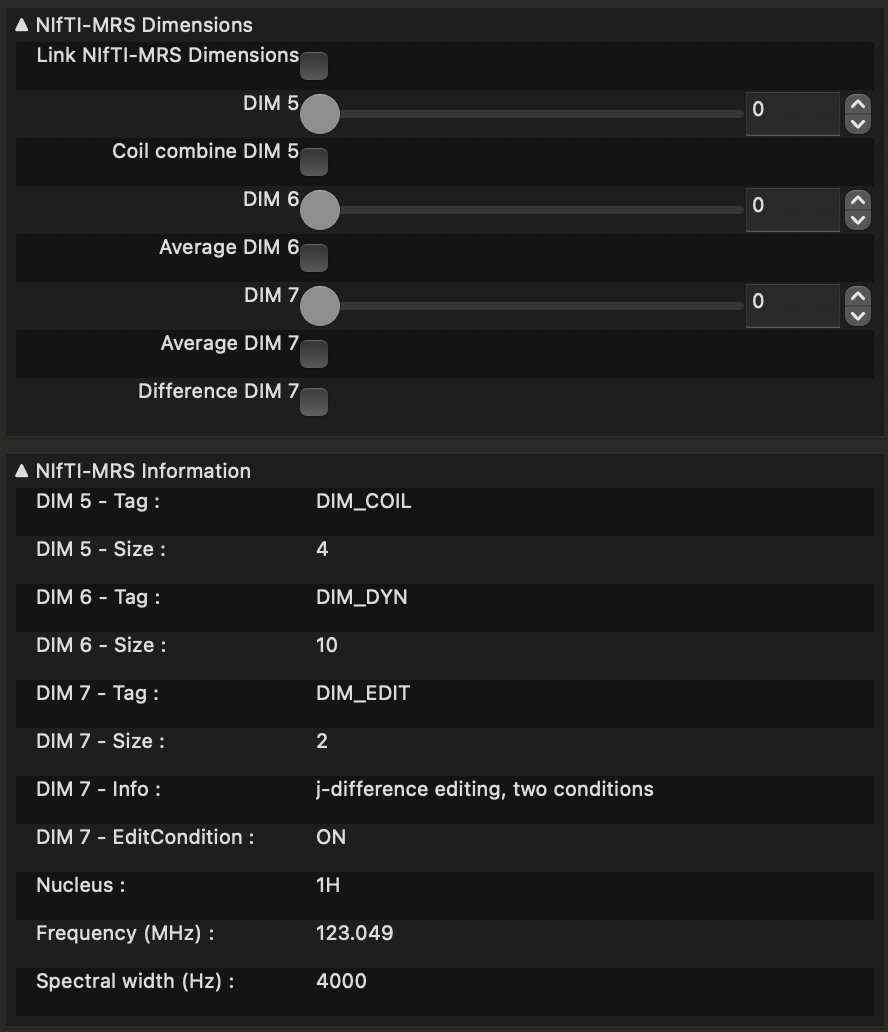
If the data uses the higher (5th, 6th or 7th) NIfTI-MRS encoding dimensions the plugin will add sliders for looping through the data. Here a synthetic MEGA-PRESS spectrum is displayed.
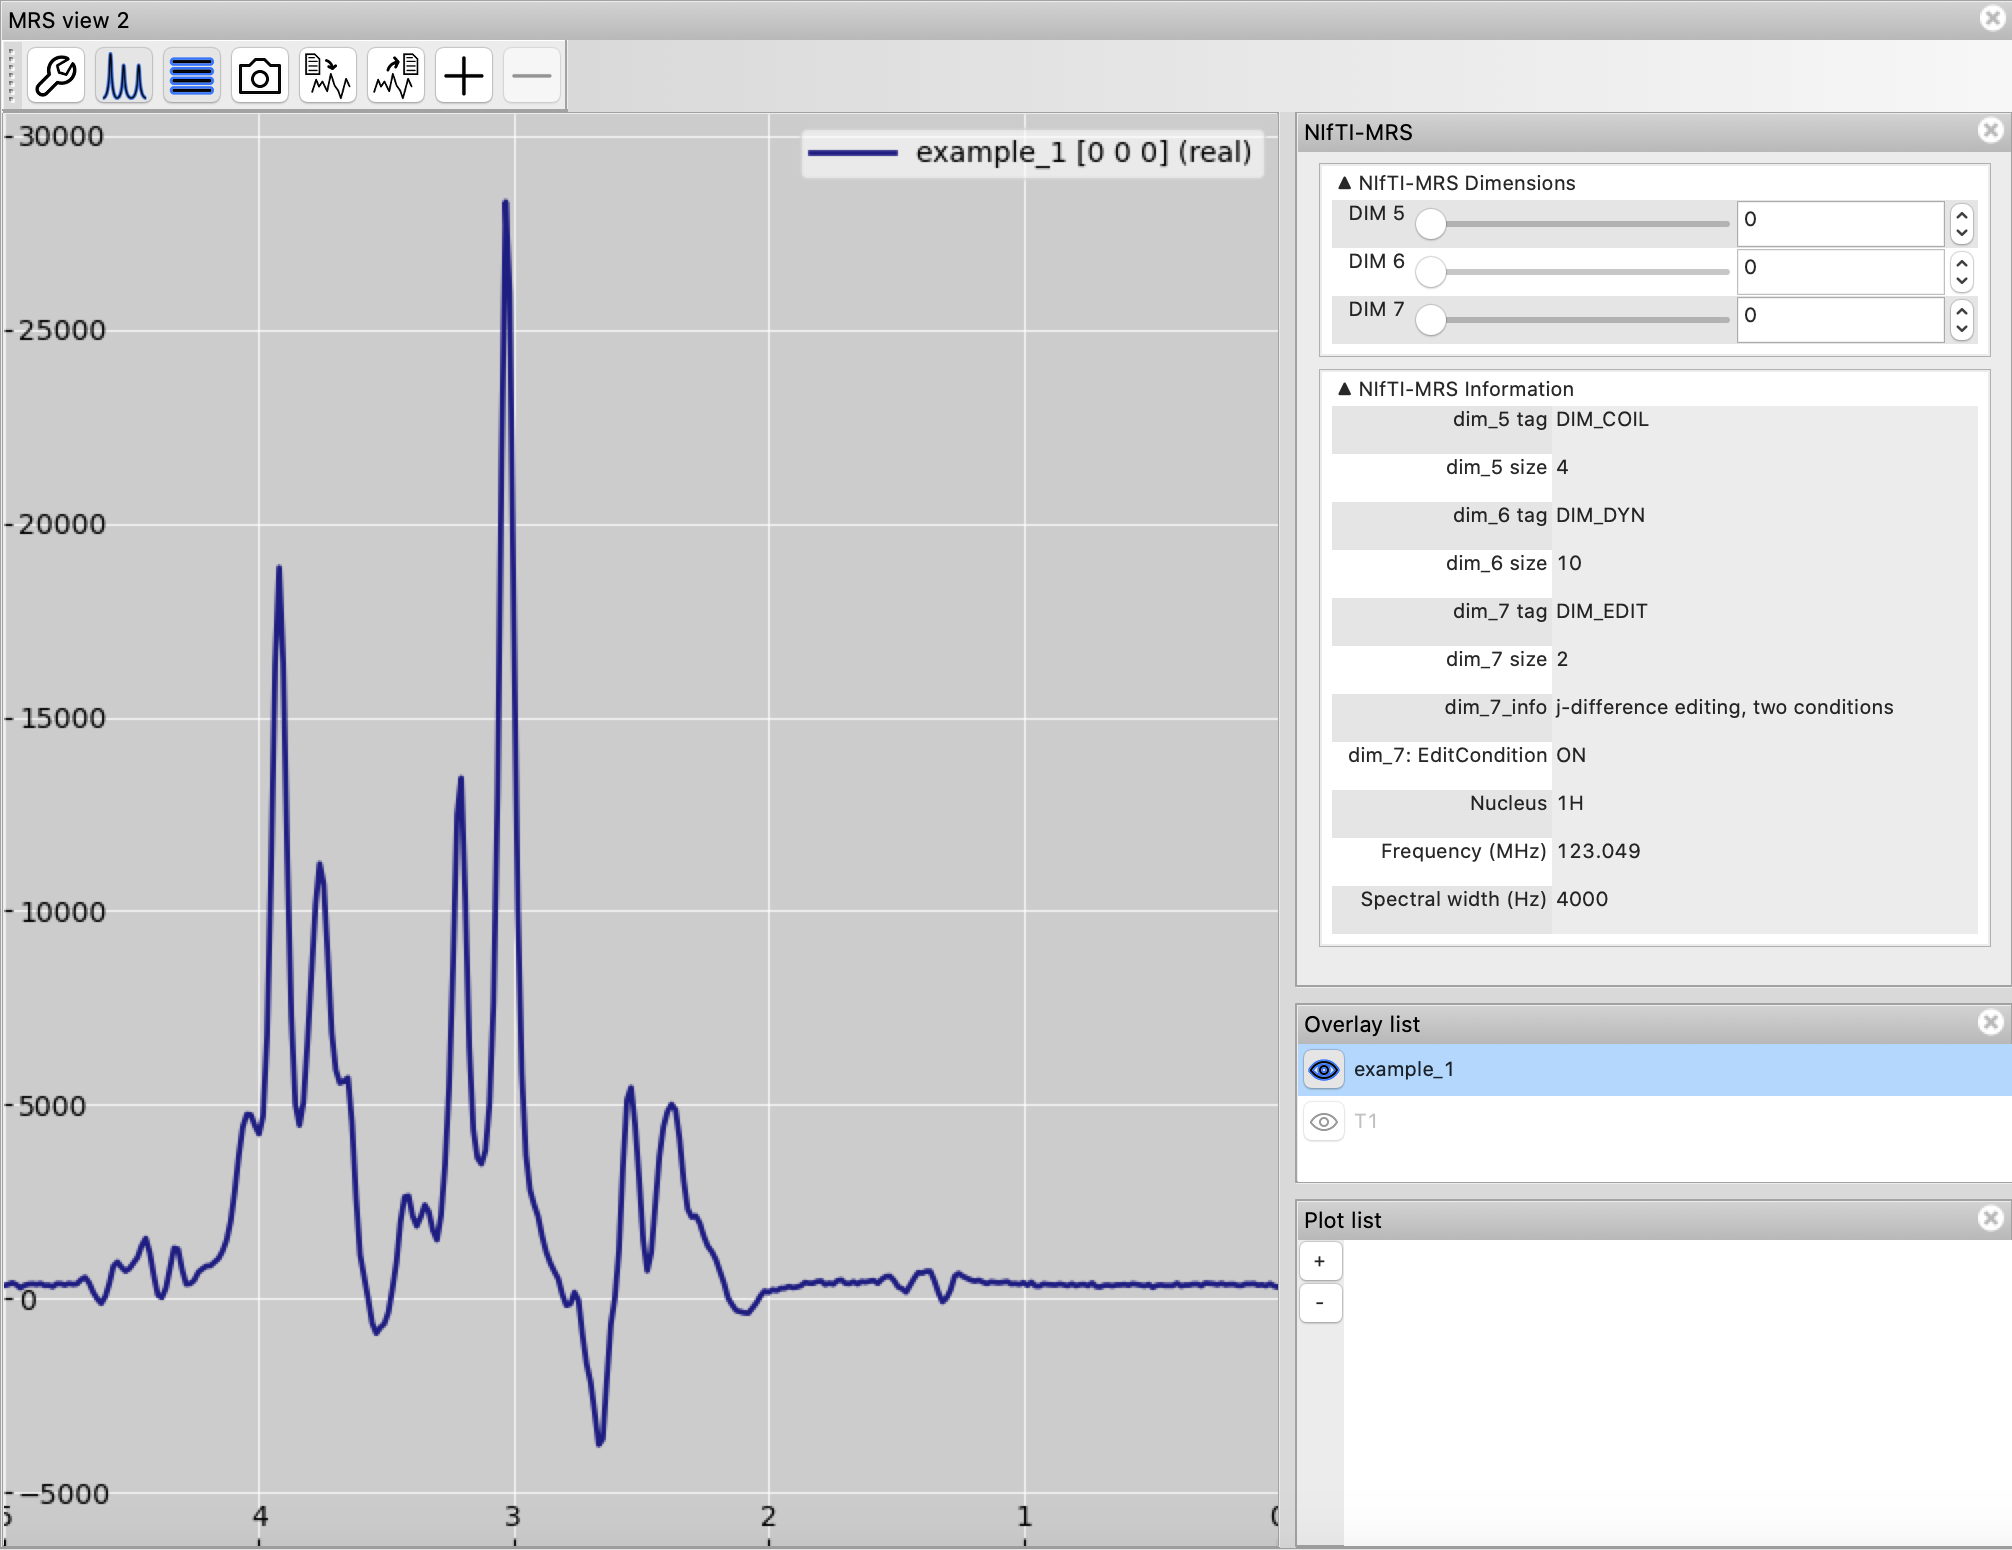
This (noiseless synthetic) data actually uses all three higher dimensions to store uncombined coils, repeated dynamics, and the editing dimension. As a result two things happen in the NIfTI-MRS panel. First the information is expanded with information about the dimensions and any dynamically changing header data. Second, sliders and check boxes are added to enable the user to view different indices of the higher dimensions, average them or calculate their difference (if there are only two indices).
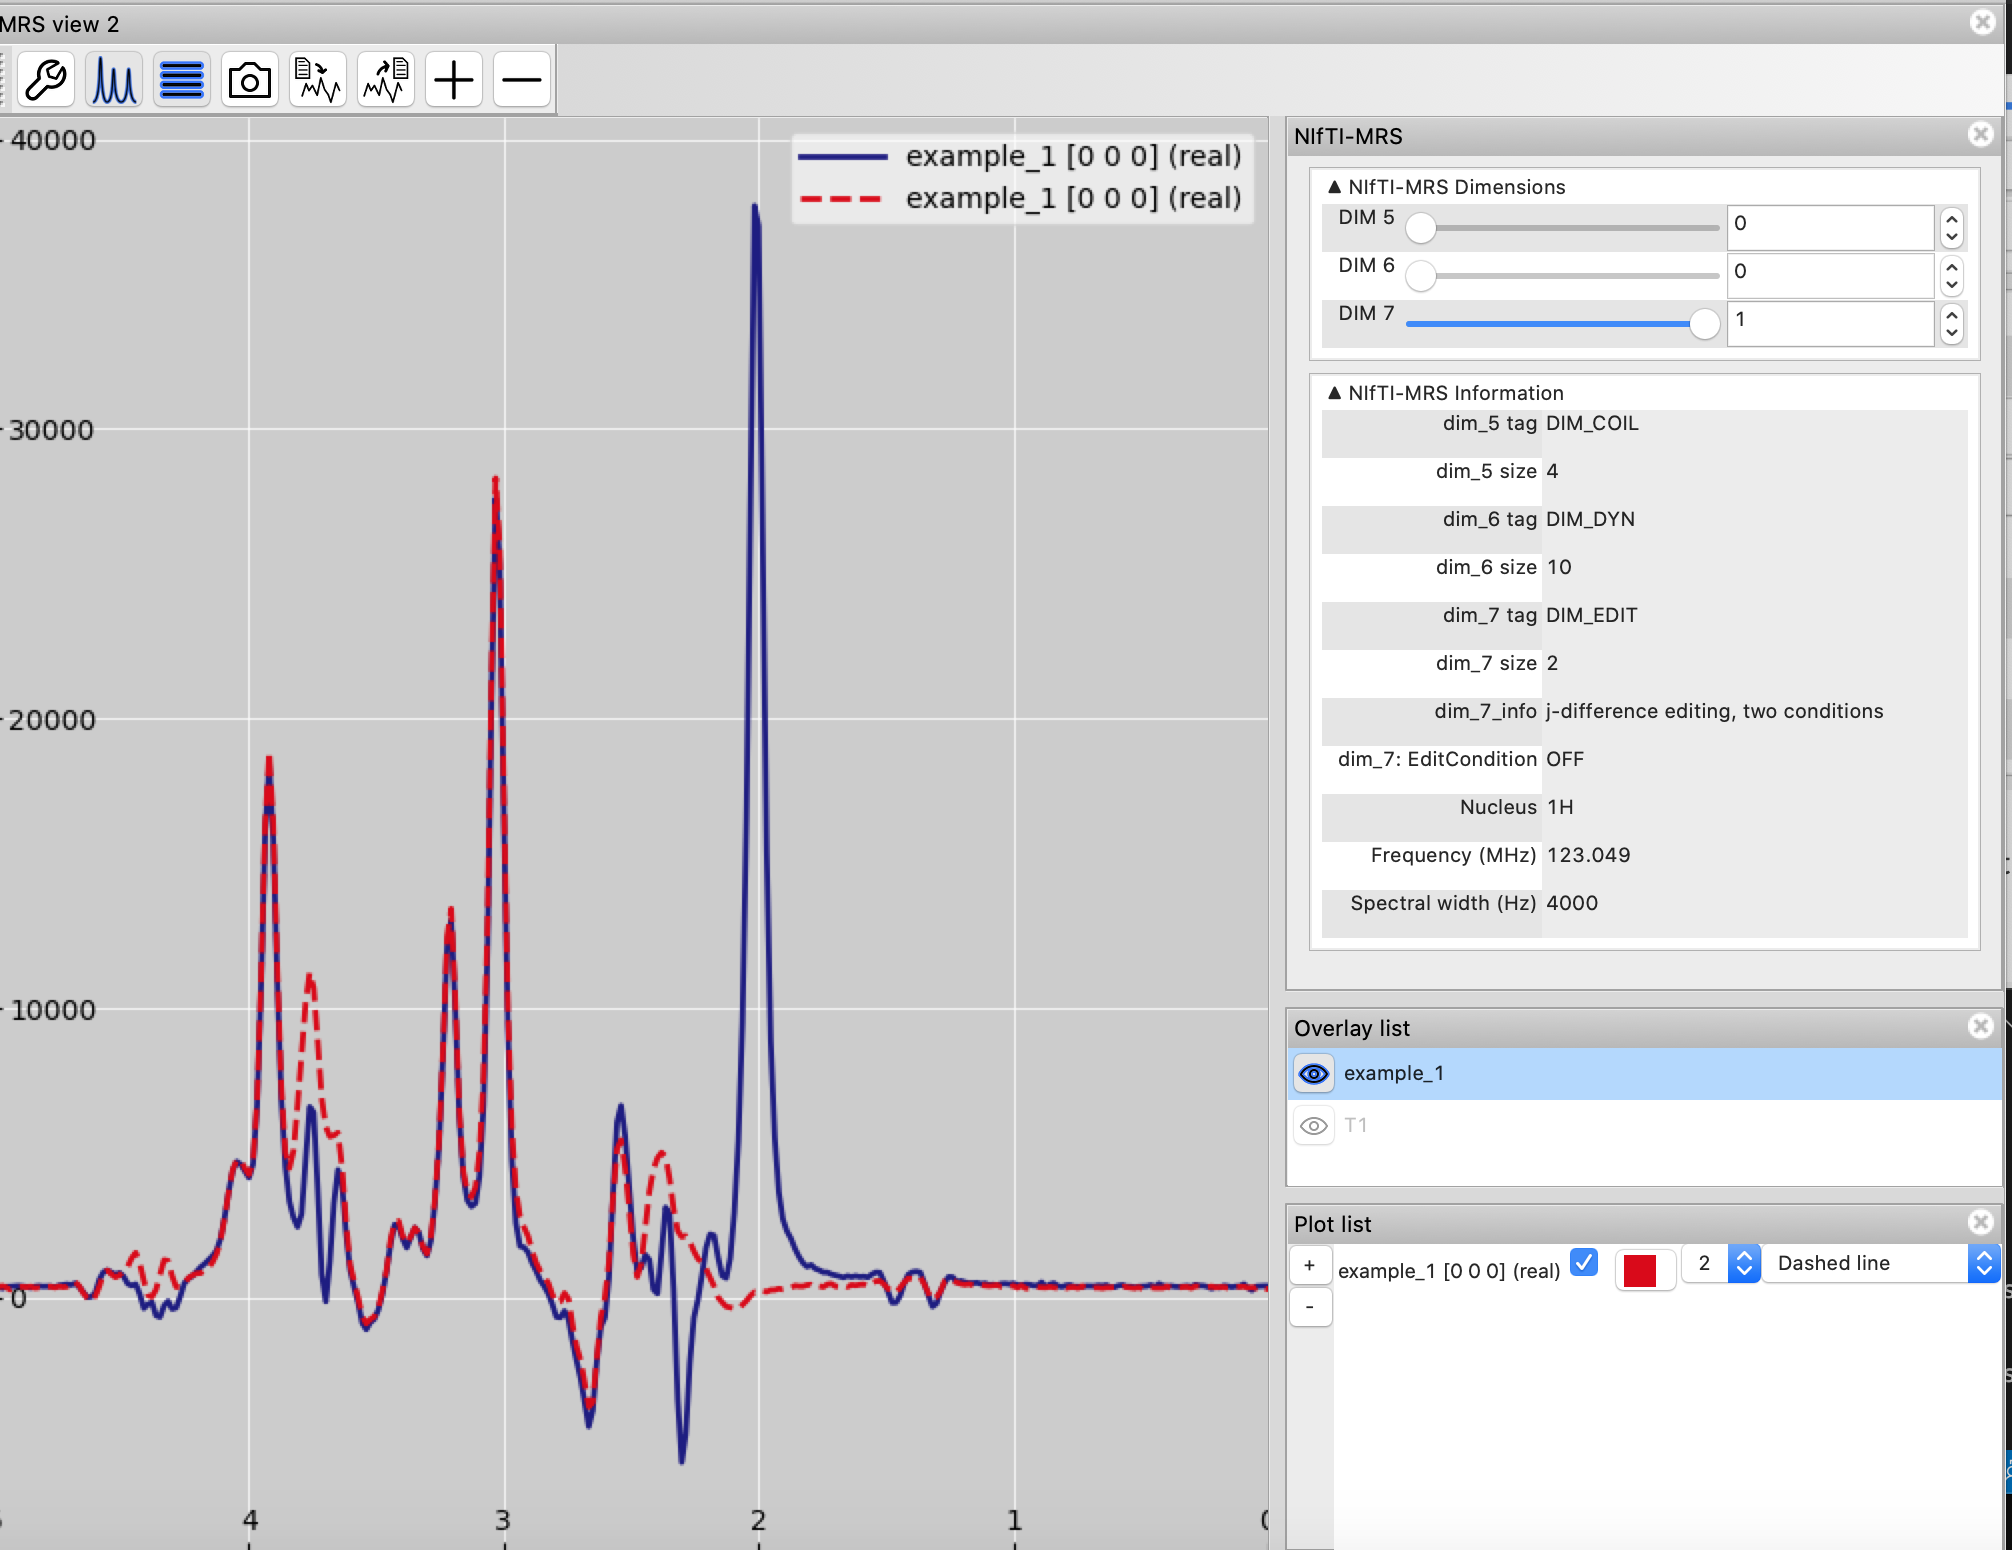
We can view different indices simultaneously by using the Plot List panel. Clicking the ‘+’ button fixes the current view, enabling us to change the slider location whilst also retaining the current spectrum. In this data we can view the two editing conditions stored in the final (7th) dimension.
Averaging, differencing and coil combining
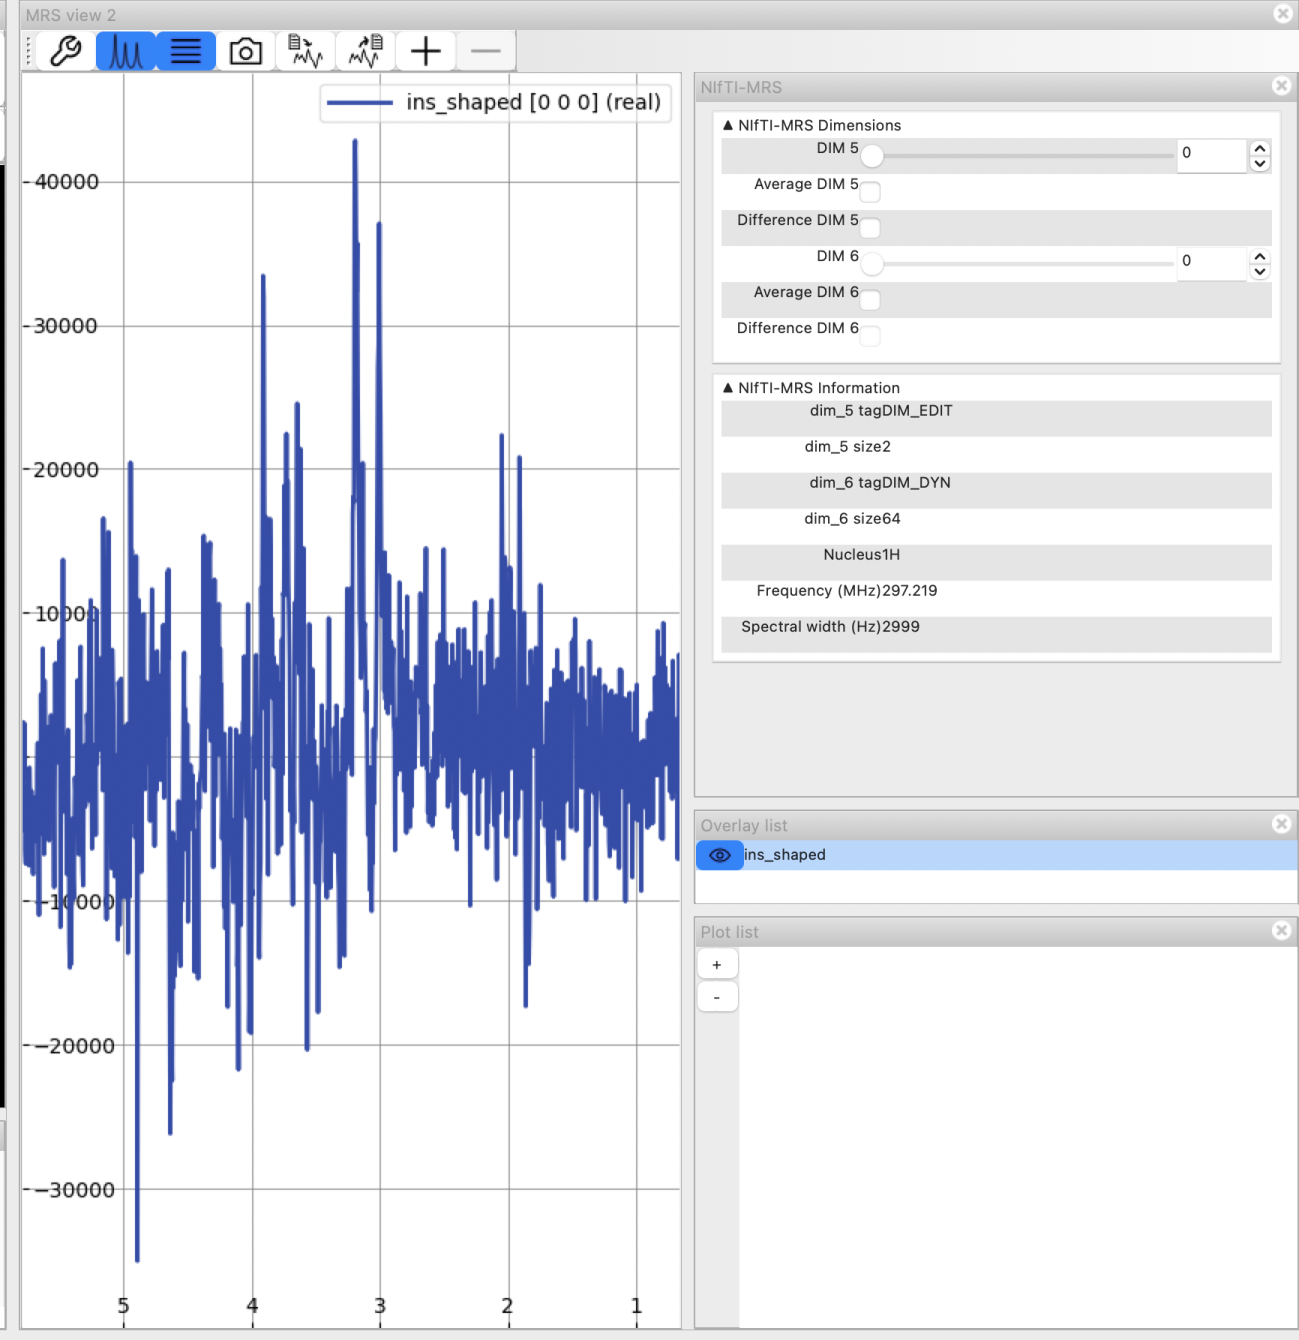
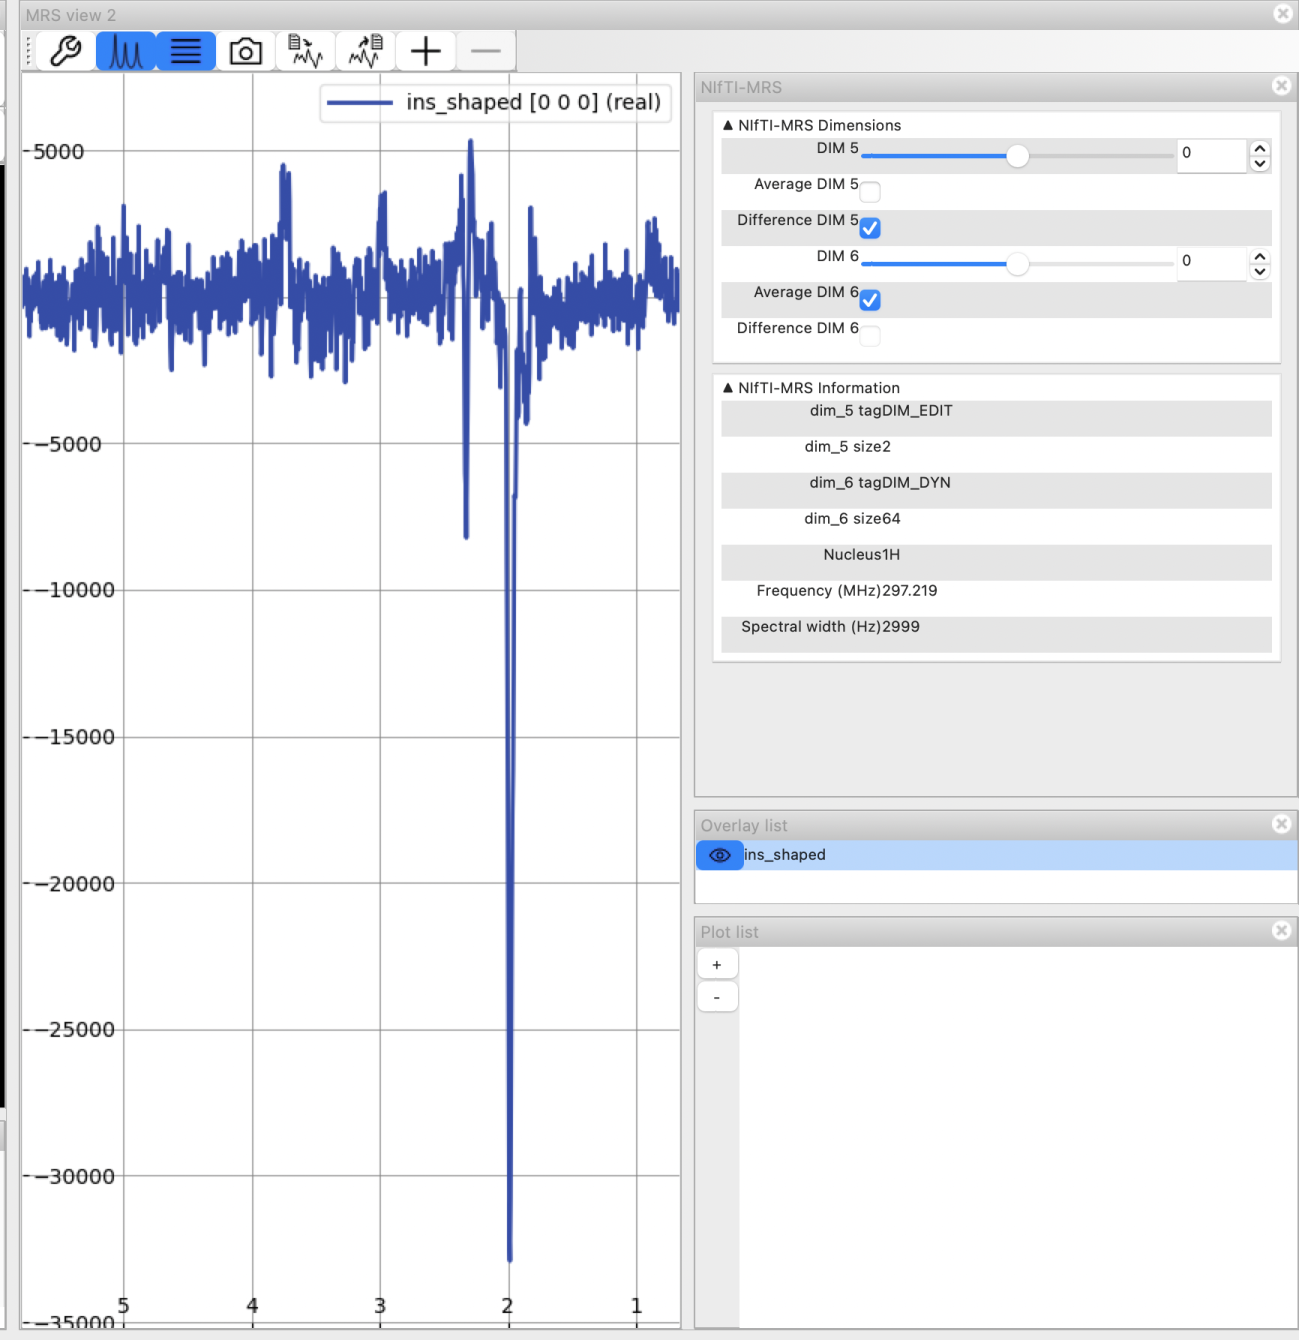
In version 0.1.0 check boxes were added to average or difference the data along a dimension. The latter is only available when there are two elements. This can be useful for quickly looking at the quality fo the data before processing, or looking at edited data. Here we have a MEGA-edited sLASER acquisition. Looking without averaging you can’t see much data.
If we tick the Average DIM 6 button then we will see all the elements of the DIM_DYN dimension averaged.

Now we can have a quick look at the difference spectrum by ticking the Difference DIM 5 button. This is the DIM_EDIT dimension and only has two elements. Note that the image shown below has also be rephased using the tools in Fsleyes.
Since version 0.1.5, there is an additional option to coil combine the DIM_COIL dimension. This is only available if fsl_mrs is installed.
Linking NIfTI-MRS dimensions across spectra
In version 0.1.5 an option was added to link NIfTI-MRS dimensions across spectra. If enabled, then the selected overlay in the MRS View overlay list is used as reference for linking. This will also be reflected in the updated overlay name. Higher dimensions that match in tag and size with the reference will be linked. This applies to slider location, averaging, differencing and coil combining options. Any dimension that does not match in tag or size will need to be changed independently. If disabled, then each spectrum’s dimensions are controlled independently. To change the reference spectrum for linking NIfTI-MRS dimensions, disable the linking, select the new reference from the overlay list, and re-enable the linking.
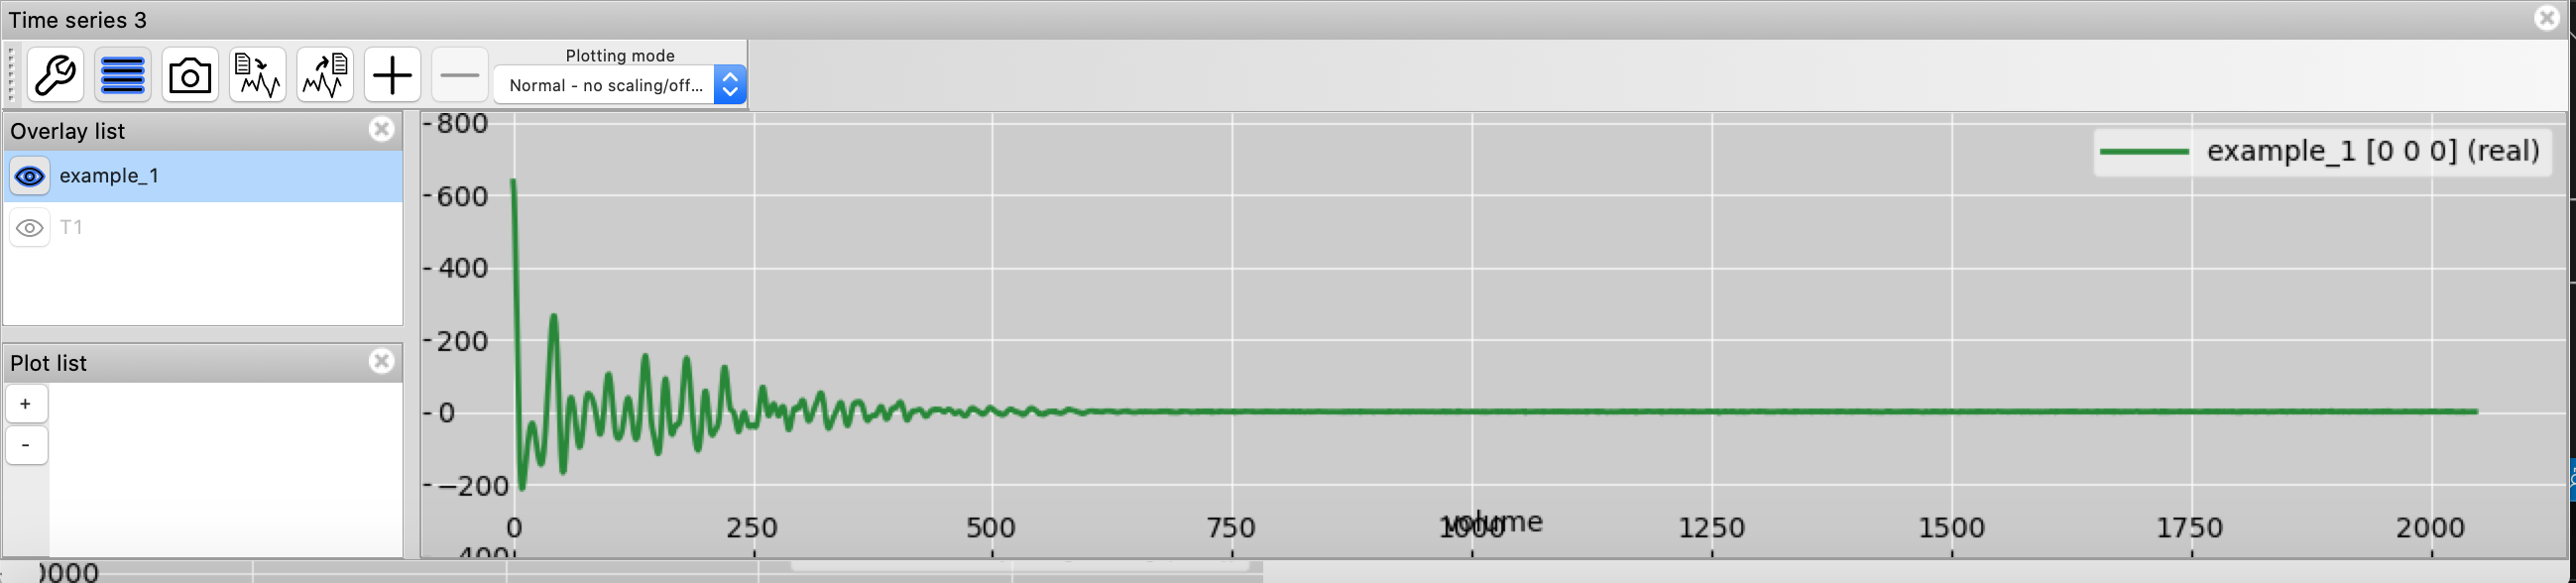
Viewing time domain data
It is possible to view the time domain data by using the Time Series view panel.
Currently, higher NIfTI-MRS dimensions are not handled in this view.