Loading MRSI Results
This plugin provides an interface to load and view MRSI fitting results from FSL-MRS, and other fitting packages.
Loading MRSI Results
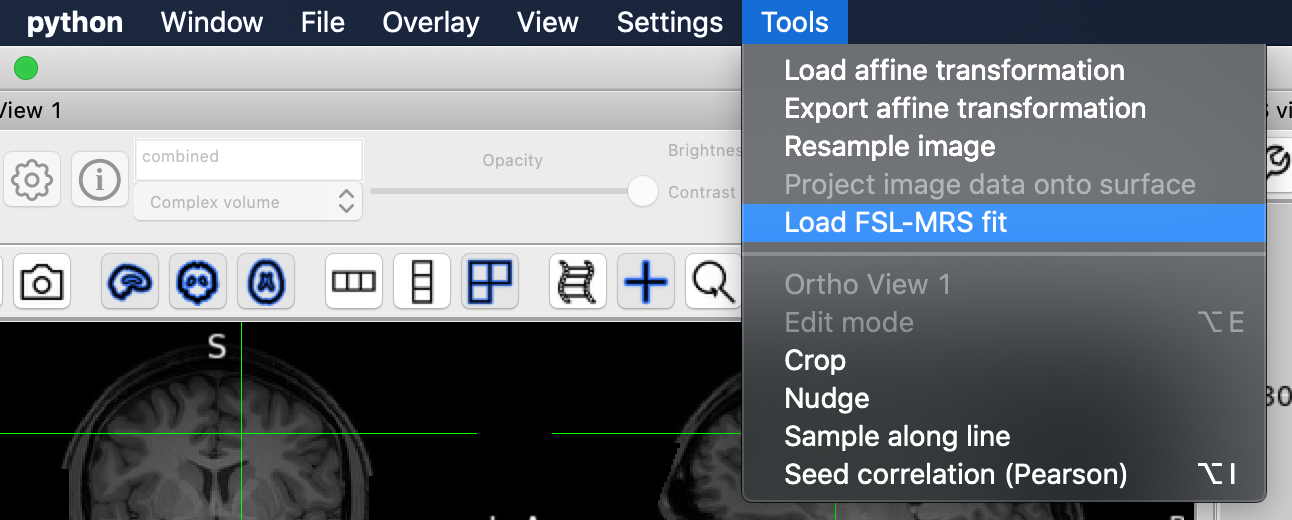
After opening the plugin and loading some MRSI data (see Loading the Plugin) load the fitting results by selecting the Load MRSI fit in the Tools menu.
Use the file system selection box that opens to select the results directory
produced by the fitting results.
For FSL-MRS’s fsl_mrsi tool it should contain concs, fit, qc, and uncertainties sub-directories.
For other fitting packages, it should contain a .tree file as specified in the
Information for Package Developers section.
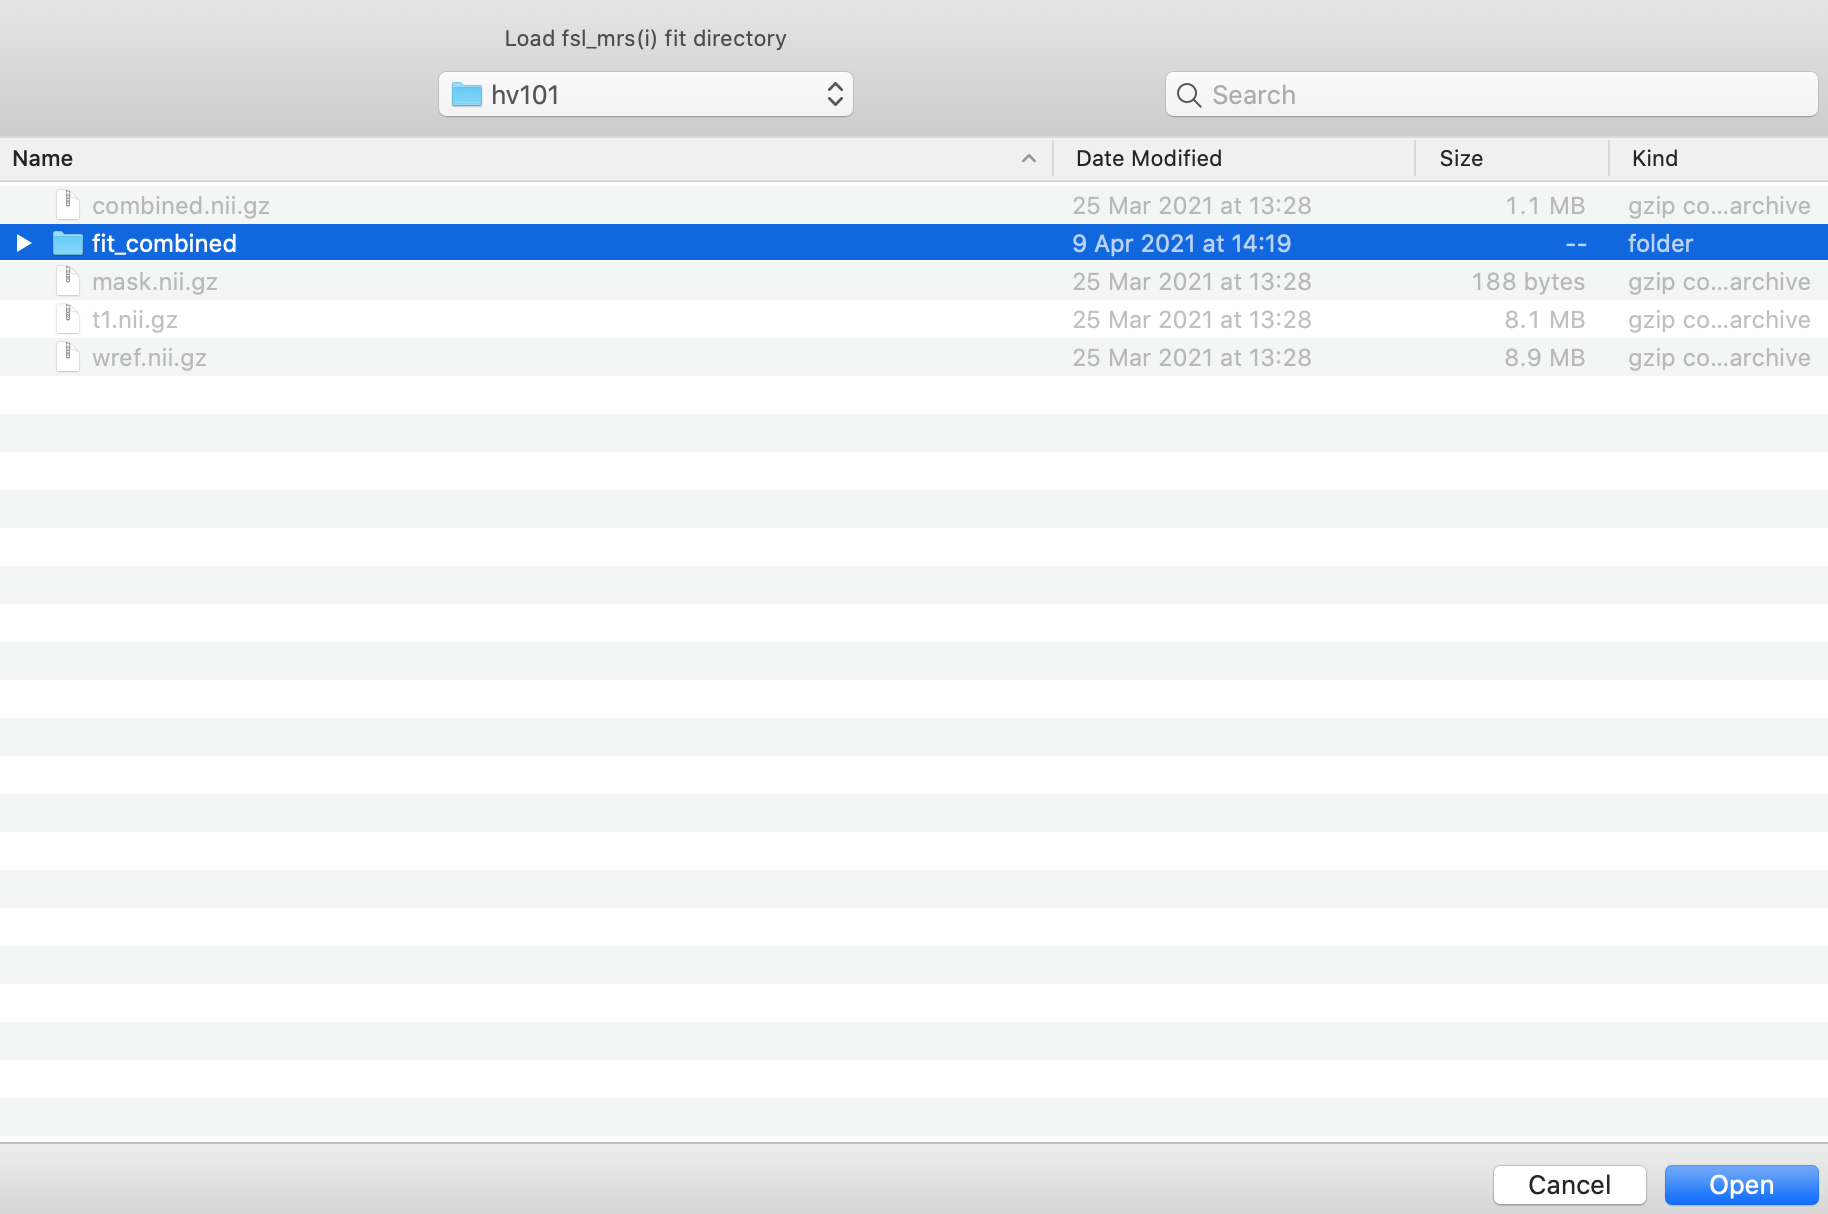
Click Open and the results data will be loaded, and a new control panel will open (see below for more information).
This step can be repeated multiple times to load different fits of the same data. Loading multiple fits will result in a new orthographic window opening for the second and any subsequent fits.
Viewing Fits
After the MRSI results have been loaded the fit (and optionally, the baseline and residual) will be displayed, on top of the spectrum in the MRS View panel.
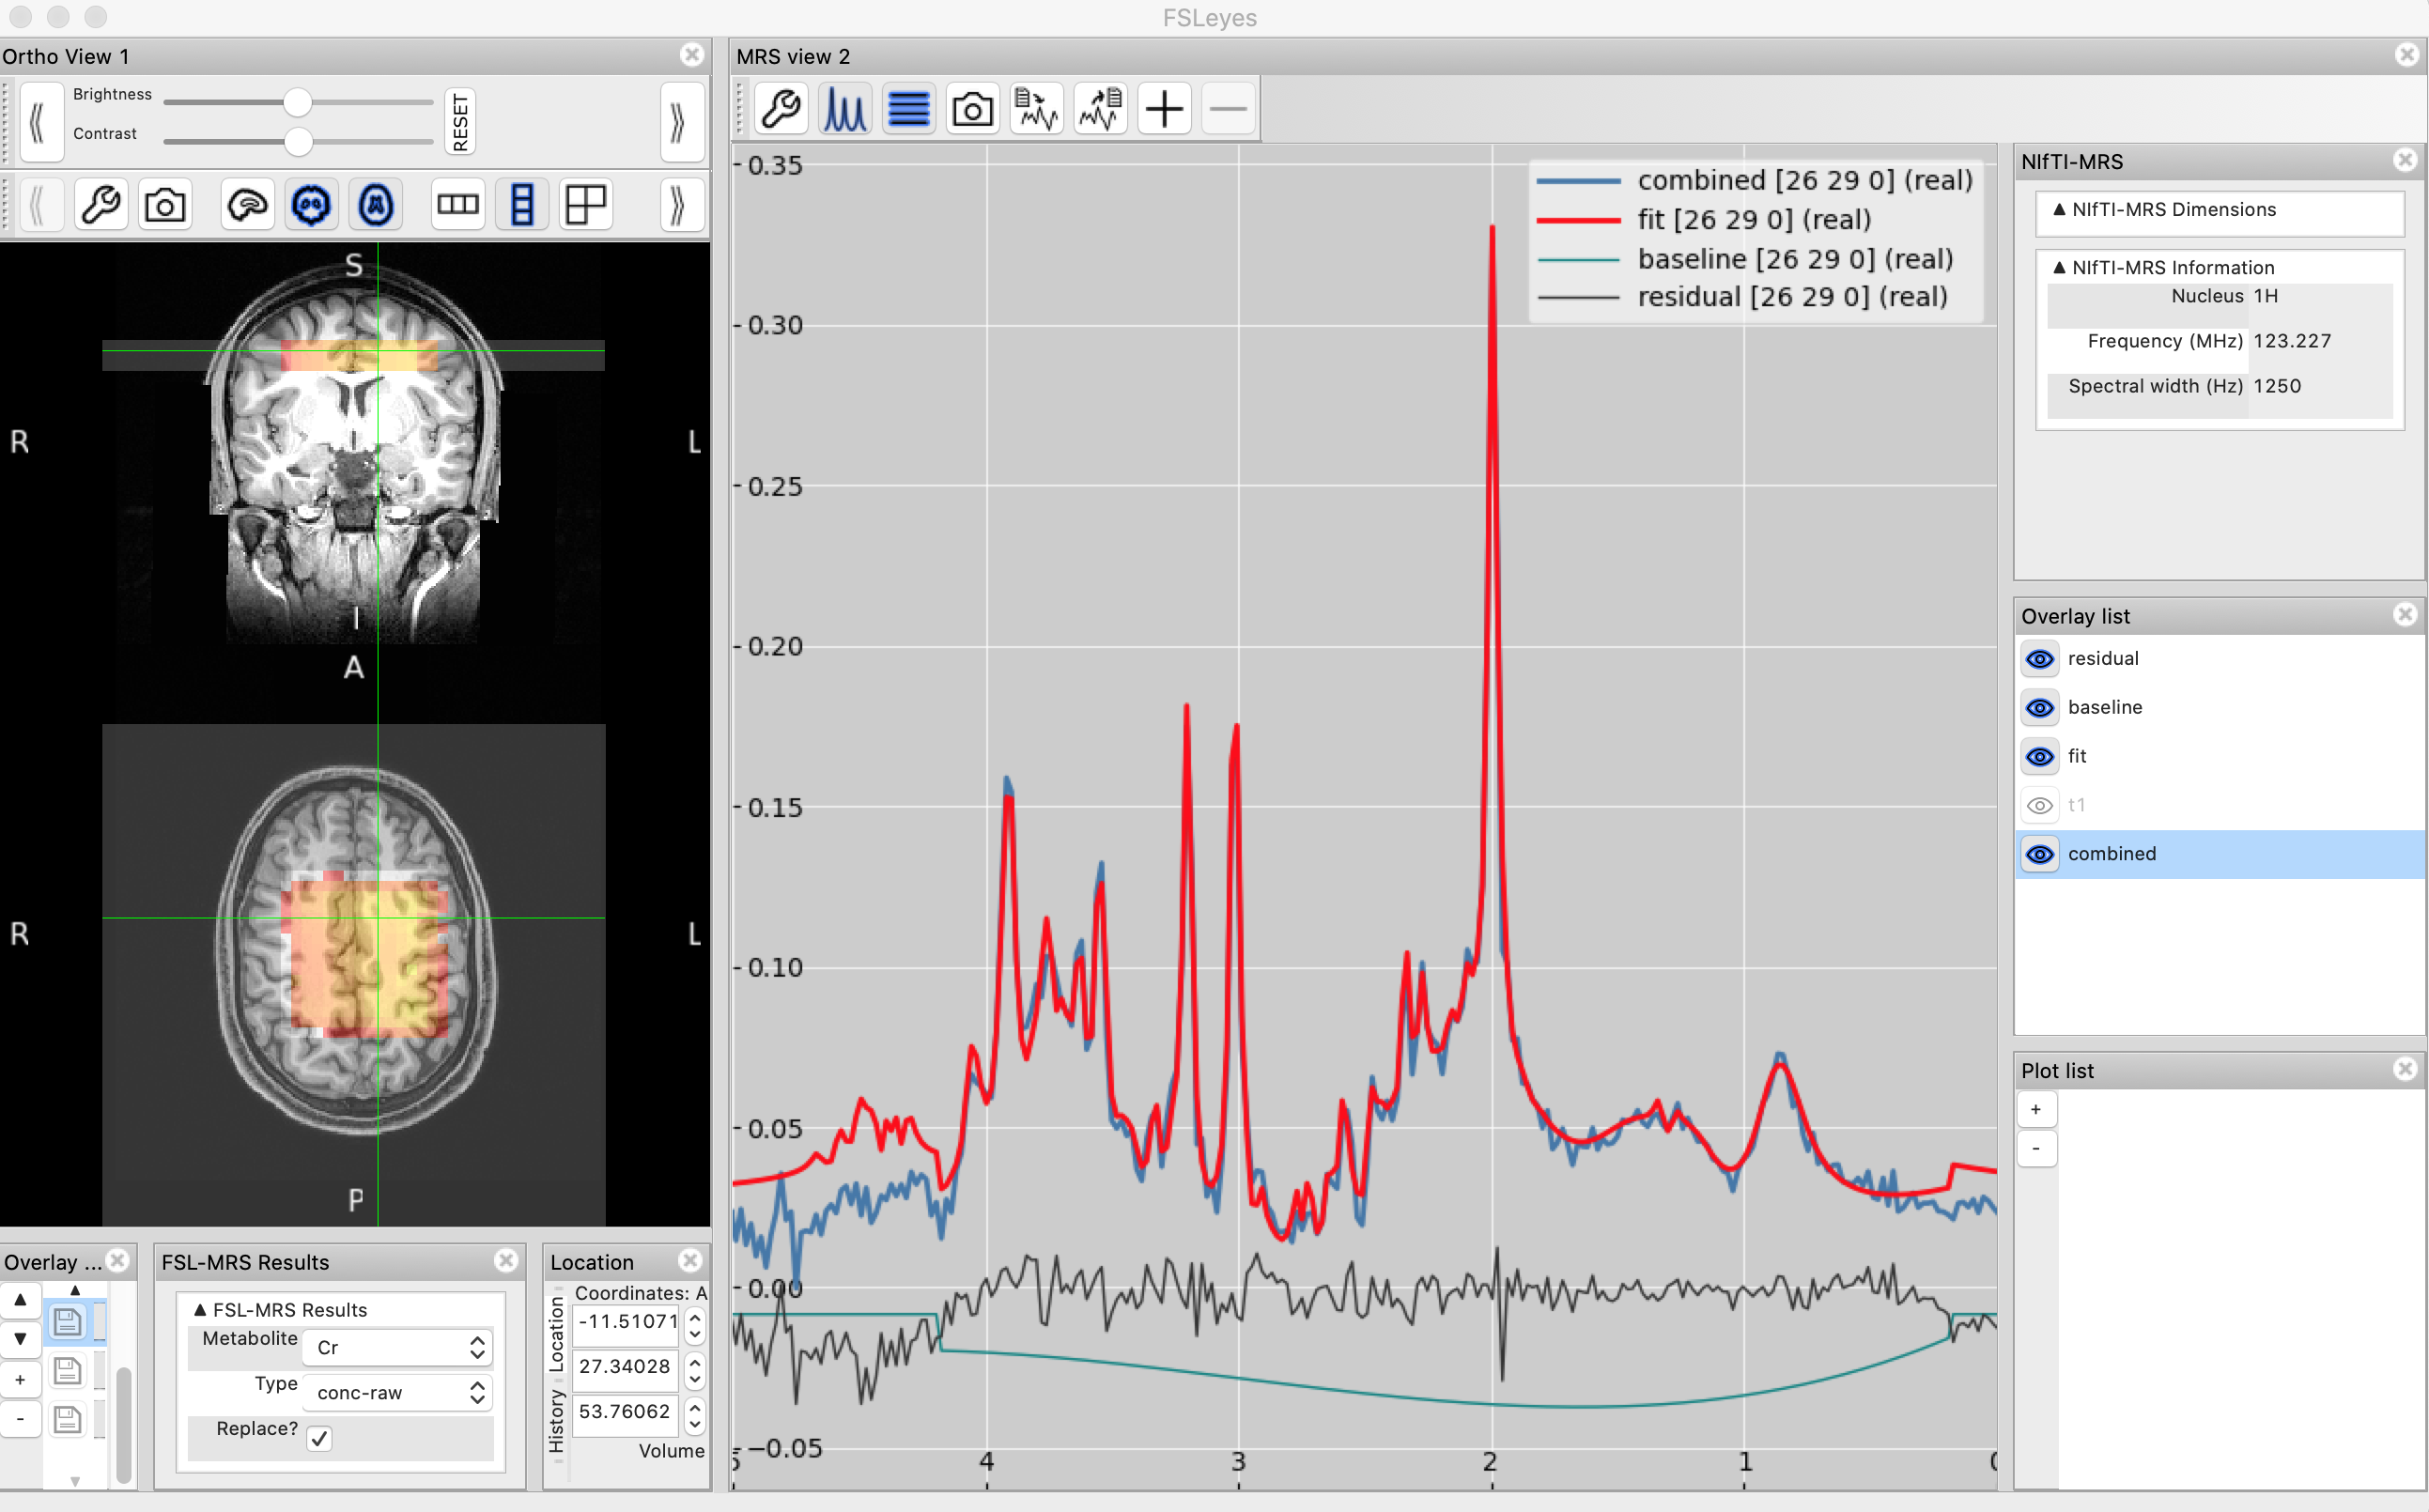
The data and fit (and baseline and residual) lines will update as the cursor is dragged over each voxel in the orthographic view.
Metabolite and QC maps
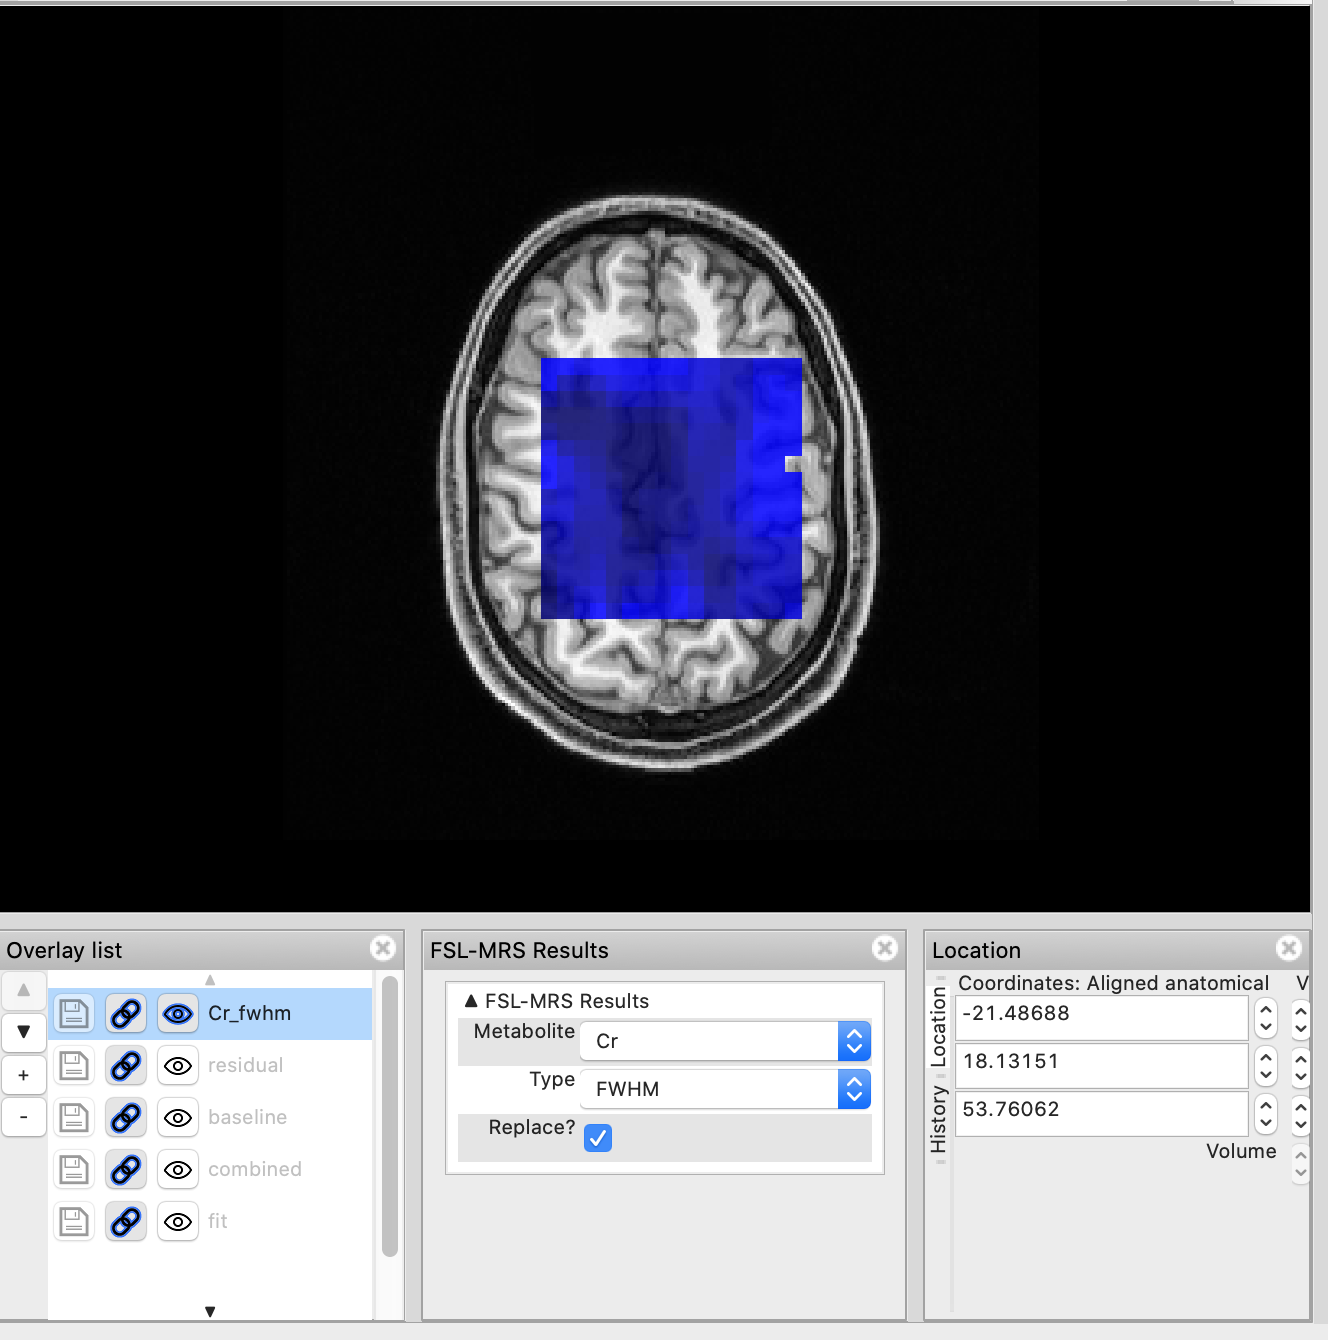
The Load MRSI fit action will also create a MRSI map control panel adjacent to the orthographic view panel.

This panel allows the user to quickly load metabolite maps. For example selecting NAA+NAAG in the Metabolite drop-down and conc-internal will load the metabolite map of NAA+NAAG concentrations referenced to total creatine.
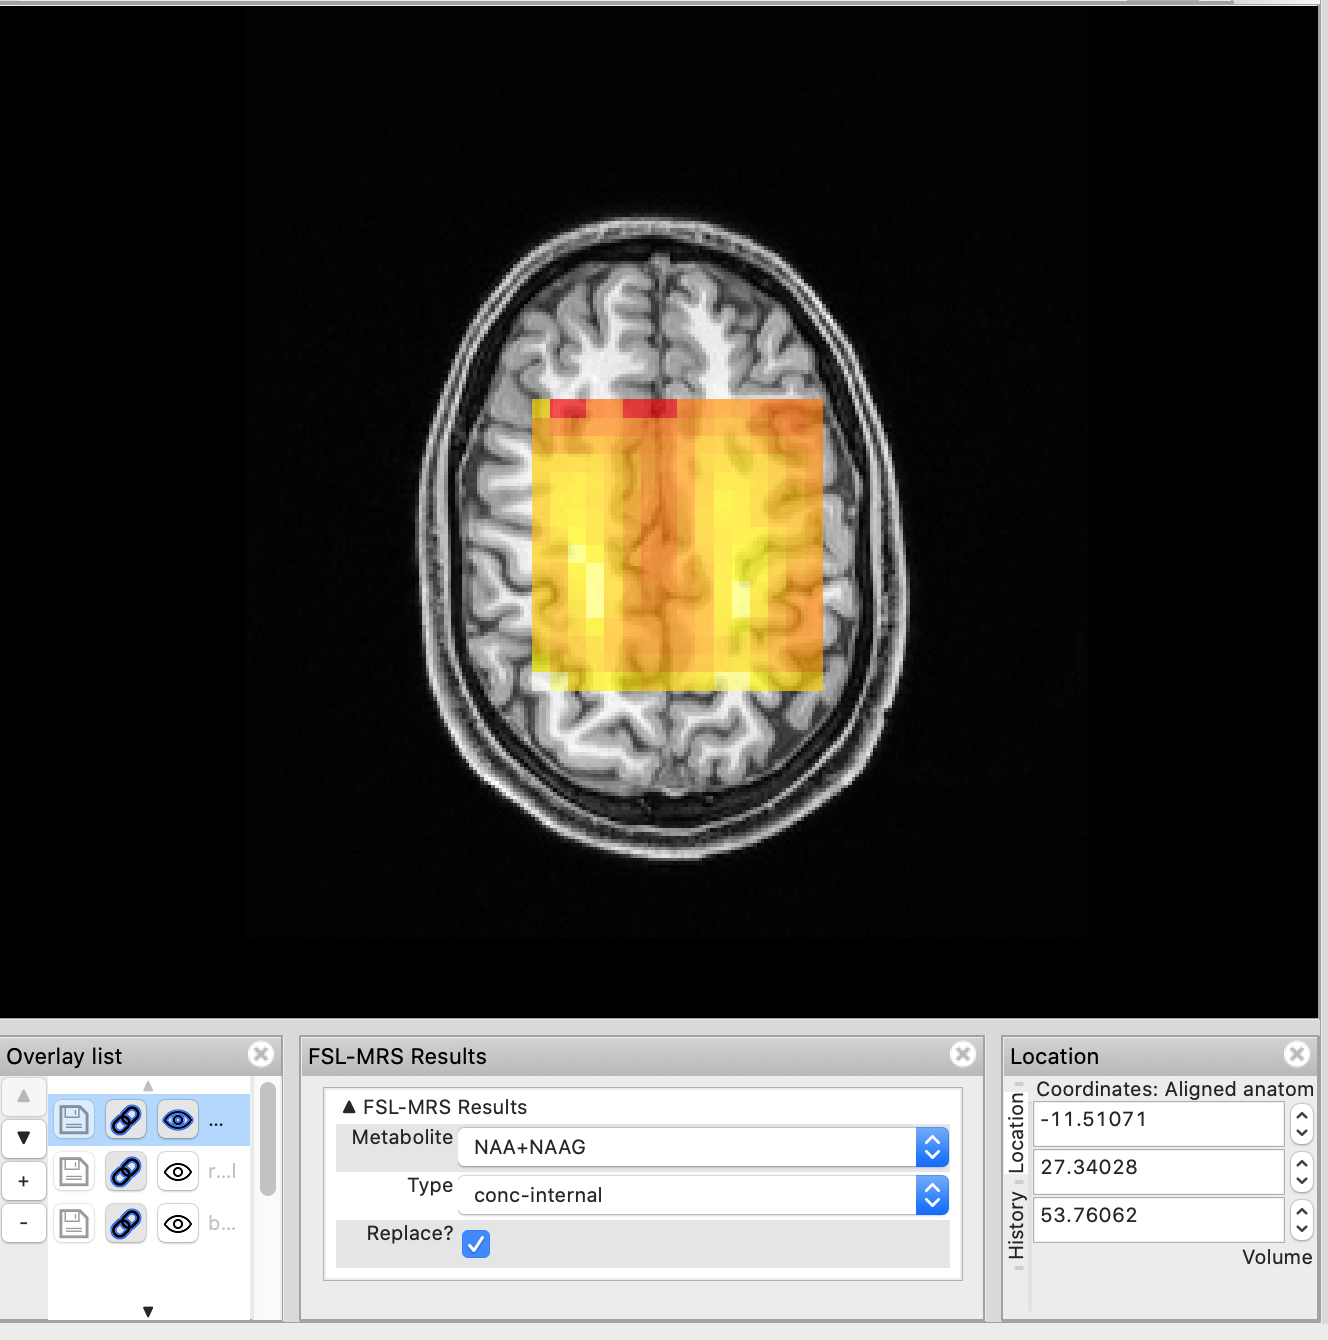
Selecting a different map (Cr & FWHM) will remove the previous metabolite map and load the new one. If you want to retain the previous map, untick Replace? before selecting a new map. Overlays can also be managed through the Overlay list panel.
Information for Package Developers
The Load MRSI fit tool can be used to load MRSI results from arbitrary software packages, so long as they output results as a well defined, but arbitrary structure of NIfTI(-MRS) files.
The Load MRSI fit acts on a directory, in which it will look for a
.tree file. .tree files are interpreted by the file-tree package,
and can be used to interpret and label a structured set of data files.
The .tree file is used to find both MRSI data (and its fit, residual, baseline etc), and associated metabolite maps and QC metrics.
These files then be interpreted by the tool, and listed in the MRSI results panel so the user can select and load them.
We package an example .tree file, and developers who wish to use this mechanism should use this and the following rules to
construct appropriate .tree files to package with their results output.
If no tree file is specified or not located in the expected directory, our default (FSL) tree will be used if possible. If the data are incompatible with our default tree, then an error will be thrown.
An additional file, *colourscheme.json can be defined to customise the appearance of each spectrum / metabolite map type.
If no colourscheme file is specified or not located in the expected directory, our default FSL colourscheme will be used if possible. If the data are incompatible with our default colourscheme, then the incompatible data will not be displayed and a warning will be shown.
.tree setup instructions
Refer to the
fsleyes_plugin_mrs/default_mrsi.treeexample file provided and the file-tree tutorial.- Define the data structure as seen from the directory you output, and wish the user to select when loading the data.
Any first level sub-directory should be defined on a separate row without indents.
Each subsequent (nested) level should be defined with an additional indent from its level above.
- Repeated elements in file names, such as the names of metabolites, are specified as a placeholder in curly brackets. e.g. concentration_{metab}.nii.gz.
All per-metabolite files should have the same placeholder name across directories, e.g. {metab}.
They can have a different prefix and/or suffix, e.g. “{metab}_snr” or “crlb_{metab}” to identify different cases, even if not nested.
- keys, specified in brackets, e.g. (key), can be assigned to any directory or file listed on that line.
Directory names can be also used as keys by default.
Key names are unique and cannot be used more than once (including directory names).
Use the “raw-concentrations” key for your base / reference directory - this key is mandatory for the .tree to be valid.
All MRSI data that you wish to be displayed in the MRSView, should have a key starting with “fit-”.
All other keys can be defined by the developer, and will appear in the
Typedrop-down selection list.Store your .tree file in the directory you will select when loading the data. The file could be given any name as long as it has the correct extension.
Colourscheme setup instructions
Use the
fsleyes_plugin_mrs/default_colourscheme.jsonas a template.The JSON names should match the developer-specified tree file keys. Any non-matching JSON name will be ignored.
Each name should be defined as a separate JSON object with its parameters as subfields, even if you wish two or more objects to have identical subfields.
- MRSI dataseries files like ‘fit-’ are displayed in the MRSView and hence parameters like ‘lineWidth’ and ‘colour’ can be defined in the colourscheme file under the respective key-field. Further parameters such as ‘lineStyle’ and ‘alpha’ could also be defined. If any of these are not defined, then default values will be used for plotting.
Parameters are case-sensitive!
- Per-metabolite files (i.e. the ones defined via “{metab}” placeholder) are displayed in the OrthoView via the ‘MRSI map control’ panel. Image parameters like ‘cmap’, ‘displayRange’ and ‘clippingRange’ can be defined in the colourscheme file under the respective key-field. If any of these are not defined, then default values will be used for plotting.
‘displayRange’ and ‘clippingRange’ can be defined as a numerical value (e.g. “1.0”) or by data heuristics that will be evaluated within the code at execution time. Possible options are: “median”, “std”, “min”, “max” and “percentile(x)”, and any expressions derived from them (e.g. “median + 2 * std” or “percentile(75) + std”).
WARNING: Expressions entered above are evaluated using Python’s ‘eval’. Most unsafe operations are blocked, but internal Python attributes may still be accessed in unexpected ways. Use trusted input only.
Parameters are case-sensitive!
Store your .json file in the directory you will select when loading the data. The file suffix should be ‘colourscheme.json’ to be detected by the plugin.