FSL-MRS Pipelines and Fitting Visualisation
This mini practical covers automatically processing and fitting a larger dataset using FSL tools. As with all these mini-practicals, instructions on how to run FSL commands can be found on the Getting Started page.
This practical requires one dataset. Download and unzip it into your working folder:
Dataset
- FSL-Pipe
- Running a pipeline on a whole dataset.
- HTML report
- Using the interactive HTML report.
- Multi-subjects results
- Interactive visualisation of multiple datasets.
FSL-Pipe
FSL contains two tools, FSL-pipe and file-tree that combined can be used to quickly and easily assemble and run a processing pipeline on a large dataset.
Start by moving into the directory you've just unzipped.
cd fsl-mrs-pipeline-main
This directory contains a few things:
- A structured dataset in `data`
- A script to run the processing in `scripts`
- A basis set `basis_set_slaser_36` and a fitting configuration `fit_config.txt`
- An example .tree file, that defines the structure of the data
Let's then look at what the data directory contains:
file-tree example.tree
Click on the folder icon at the top to expand the display into the following list.
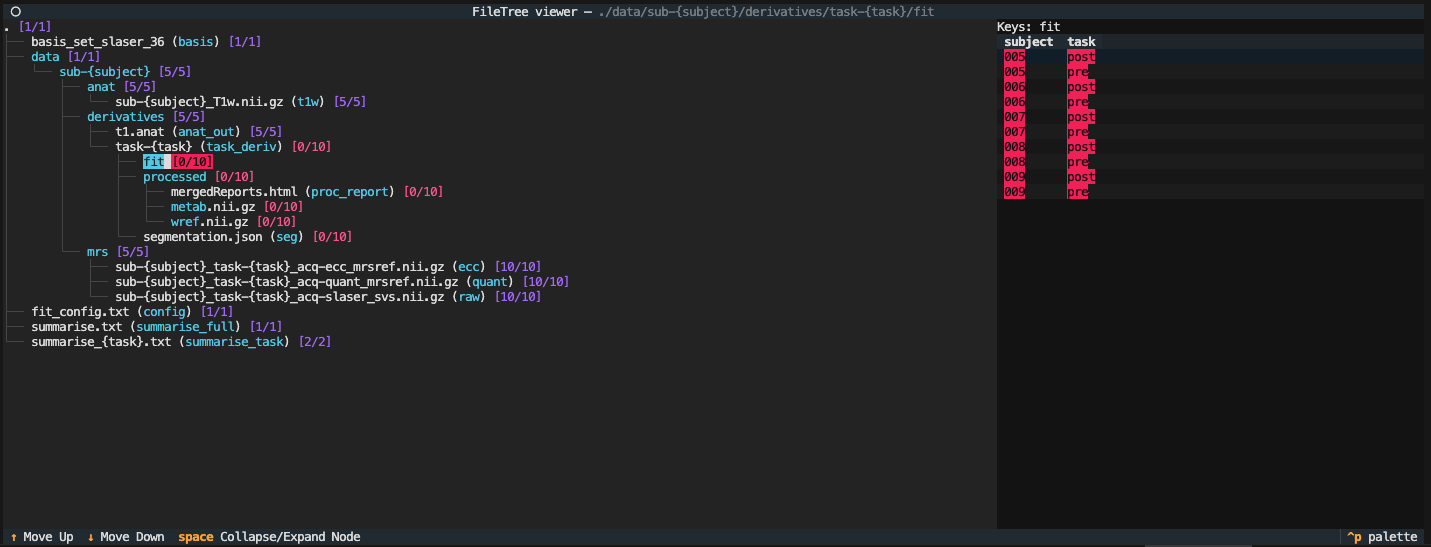
This screen shows that all the datasets [10/10] are present, but that none of the processed [0/10] or fits [0/10] have been created. Close the display using the top left circle button.
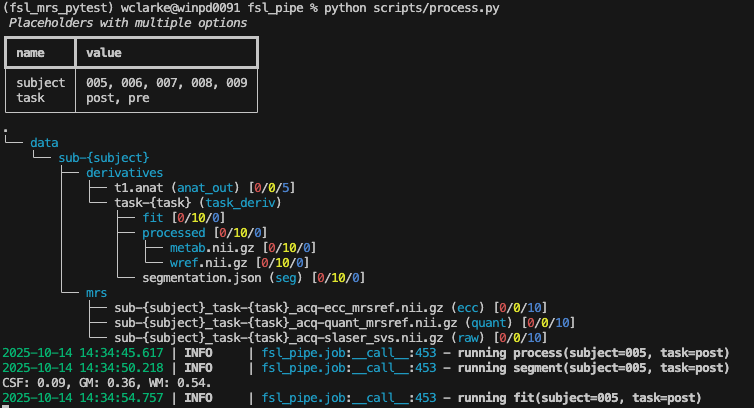
Now we will run the processing script using the following command, and you should see jobs scroll past as shown below.
python scripts/process.py
Whilst we wait for the processing to complete, the instructor will show you what goes into the script and how you could modify its behaviour for your data.
Alternatively inspect the files that control the processing:
cat scripts/process.py
cat fit_config.txt
After the script has completed running run the following again:
file-tree example.tree
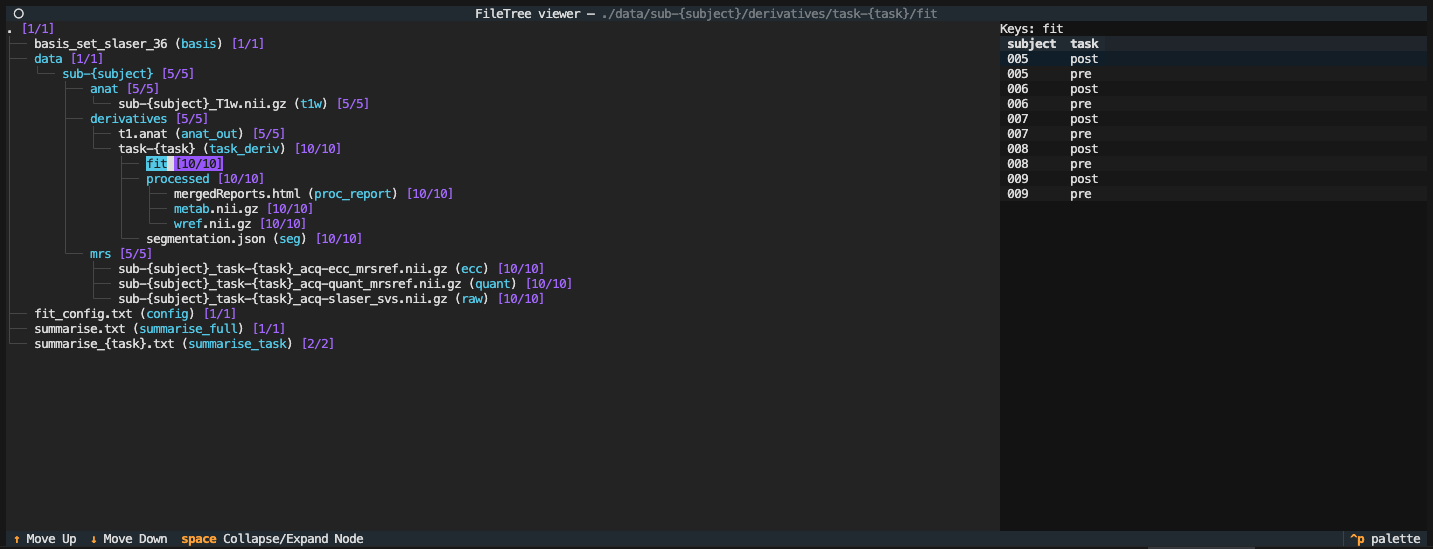
Now we can see that all processed data and fits are present (both [10/10]).
HTML report
After fitting, you can look at the results interactively using the
html report (provided you have added the --report option
in e.g. fsl_mrs).
Let's look at one of the reports. Open the report in a web browser:
firefox data/sub-005/derivatives/task-post/fit/report.html
The report should look something like this:
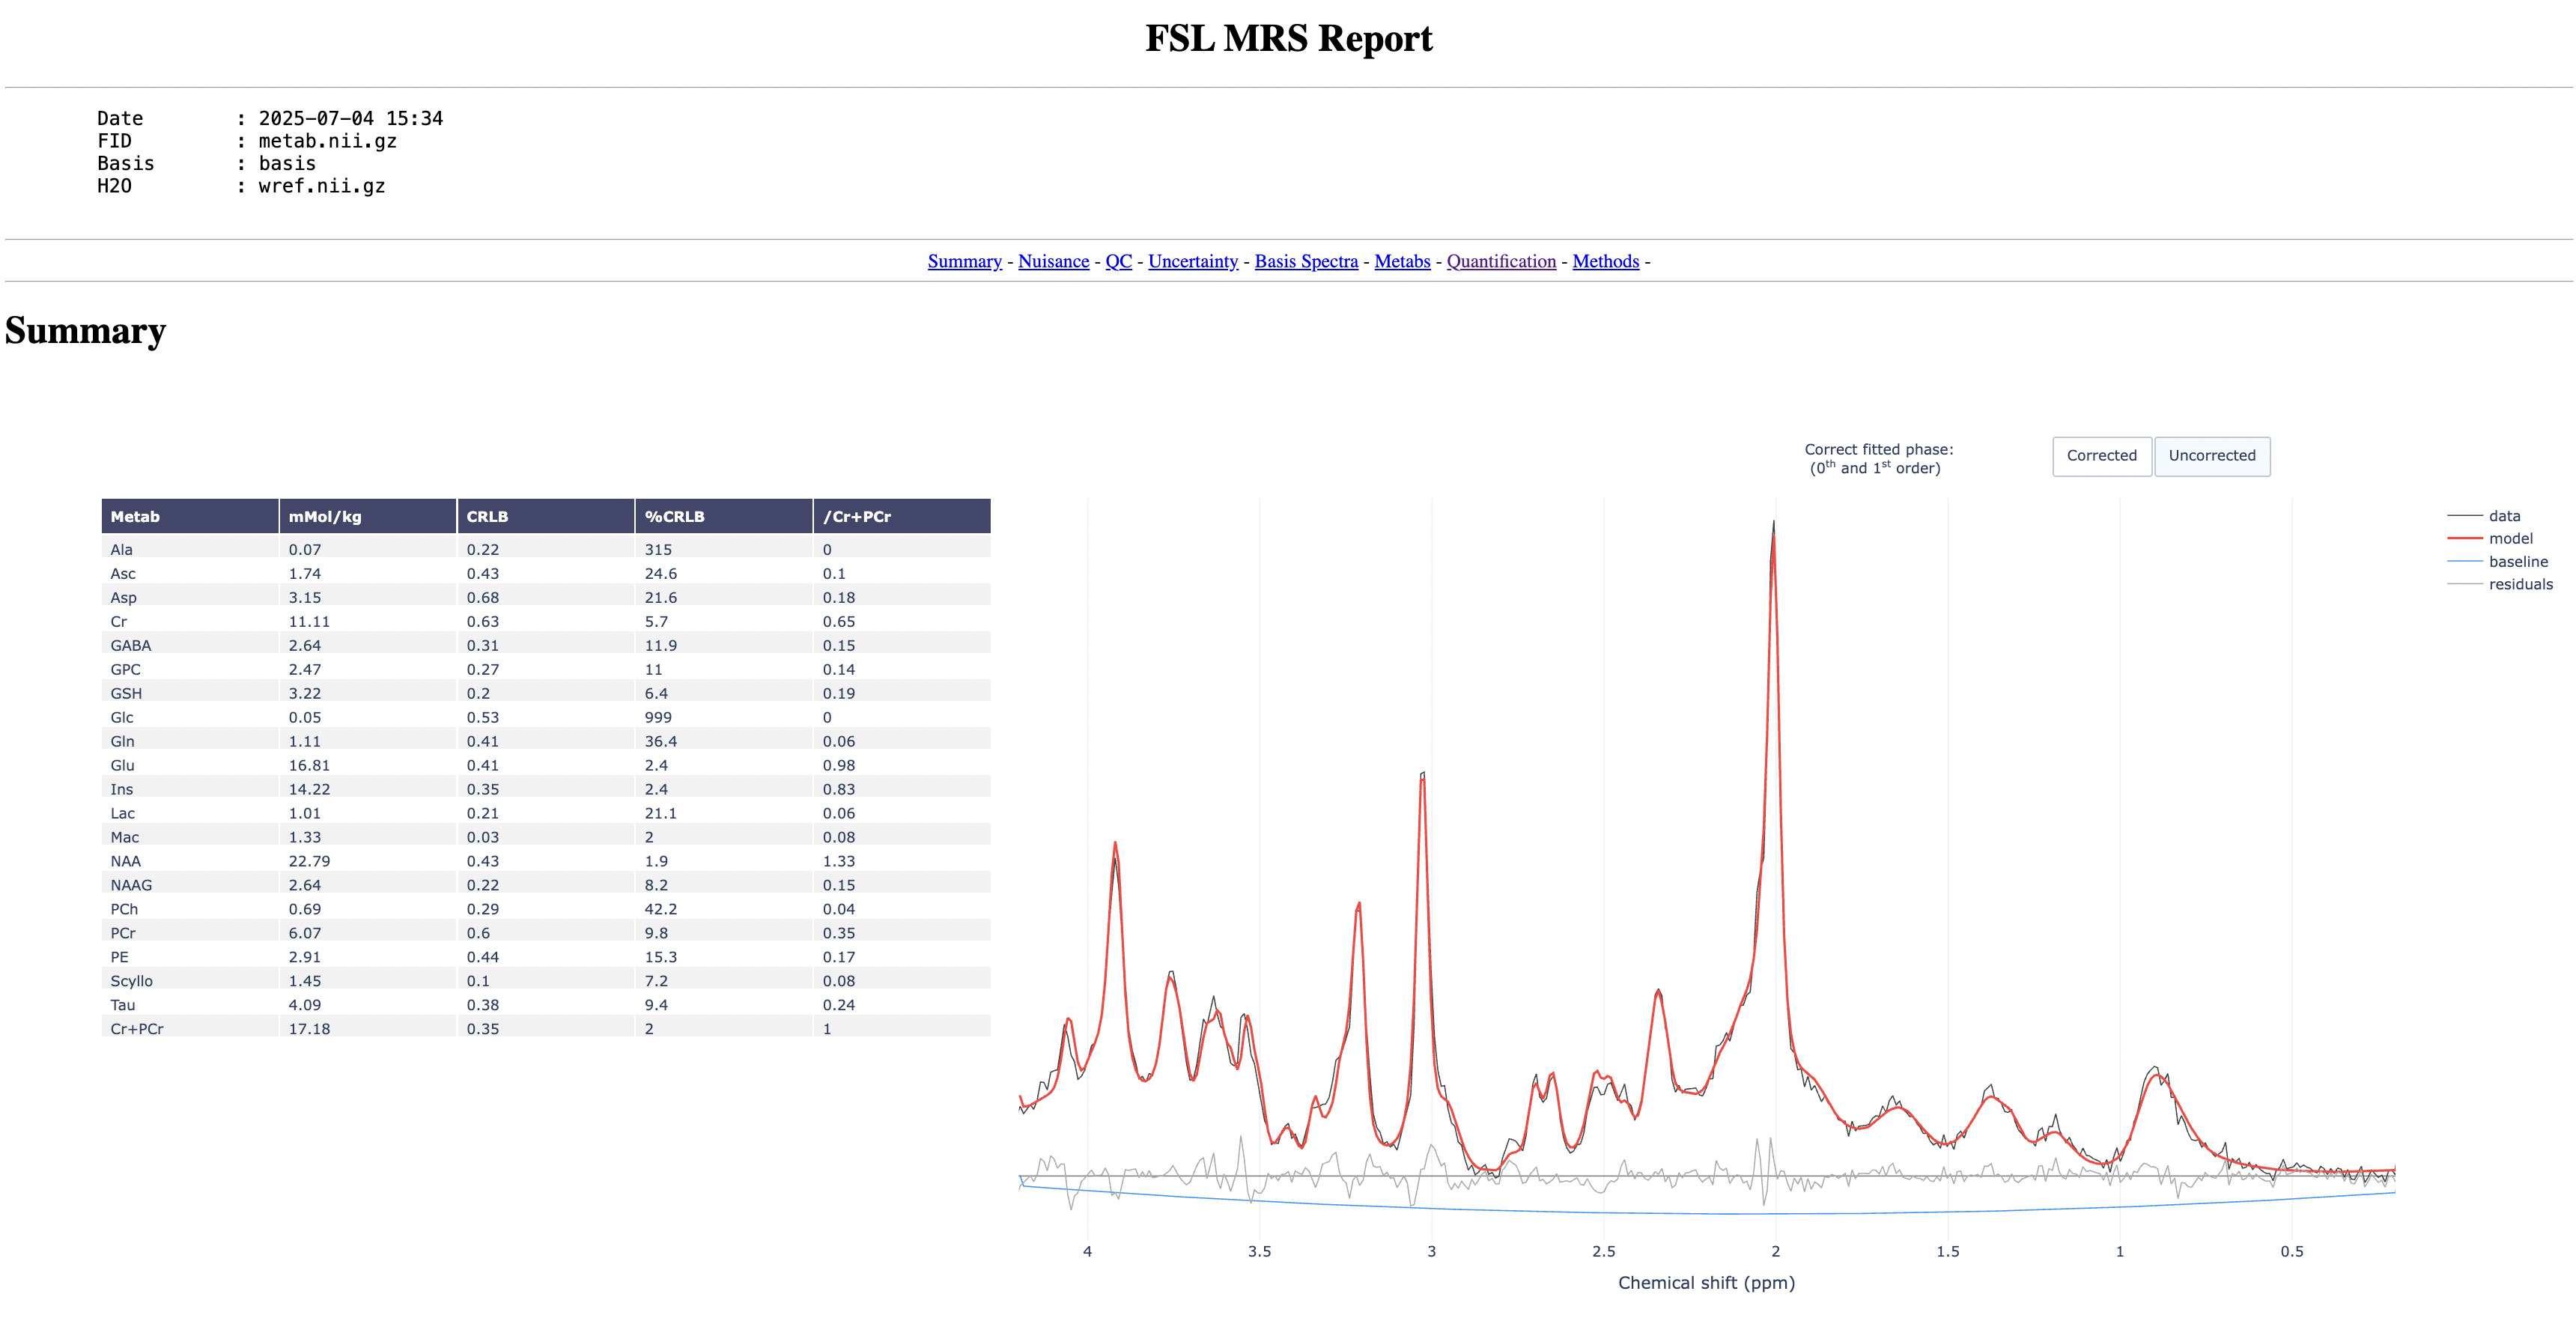
Start by toggling on and off the model to see how well it fits to the data
Now go through the report and try to answer the following questions:
- Which metabolite has the highest concentration?
- Which metabolite has the highest SNR?
- Which pair of metabolites have the highest correlation?
Multi-subjects results
After running fsl_mrs on multiple datasets (e.g. subjects),
it is not convenient to look at the results using the individual HTML reports.
There is a convenient visualisation tool called fsl_mrs_summarise
which allows you to quickly go through all the subjects and maybe identify outliers
based on their QC or concentration estimates.
Run fsl_mrs_summarise:
fsl_mrs_summarise list summarise_full.txt
If the browser does not automatically open, copy the http address from the terminal onto your web browser. You should see something like this:
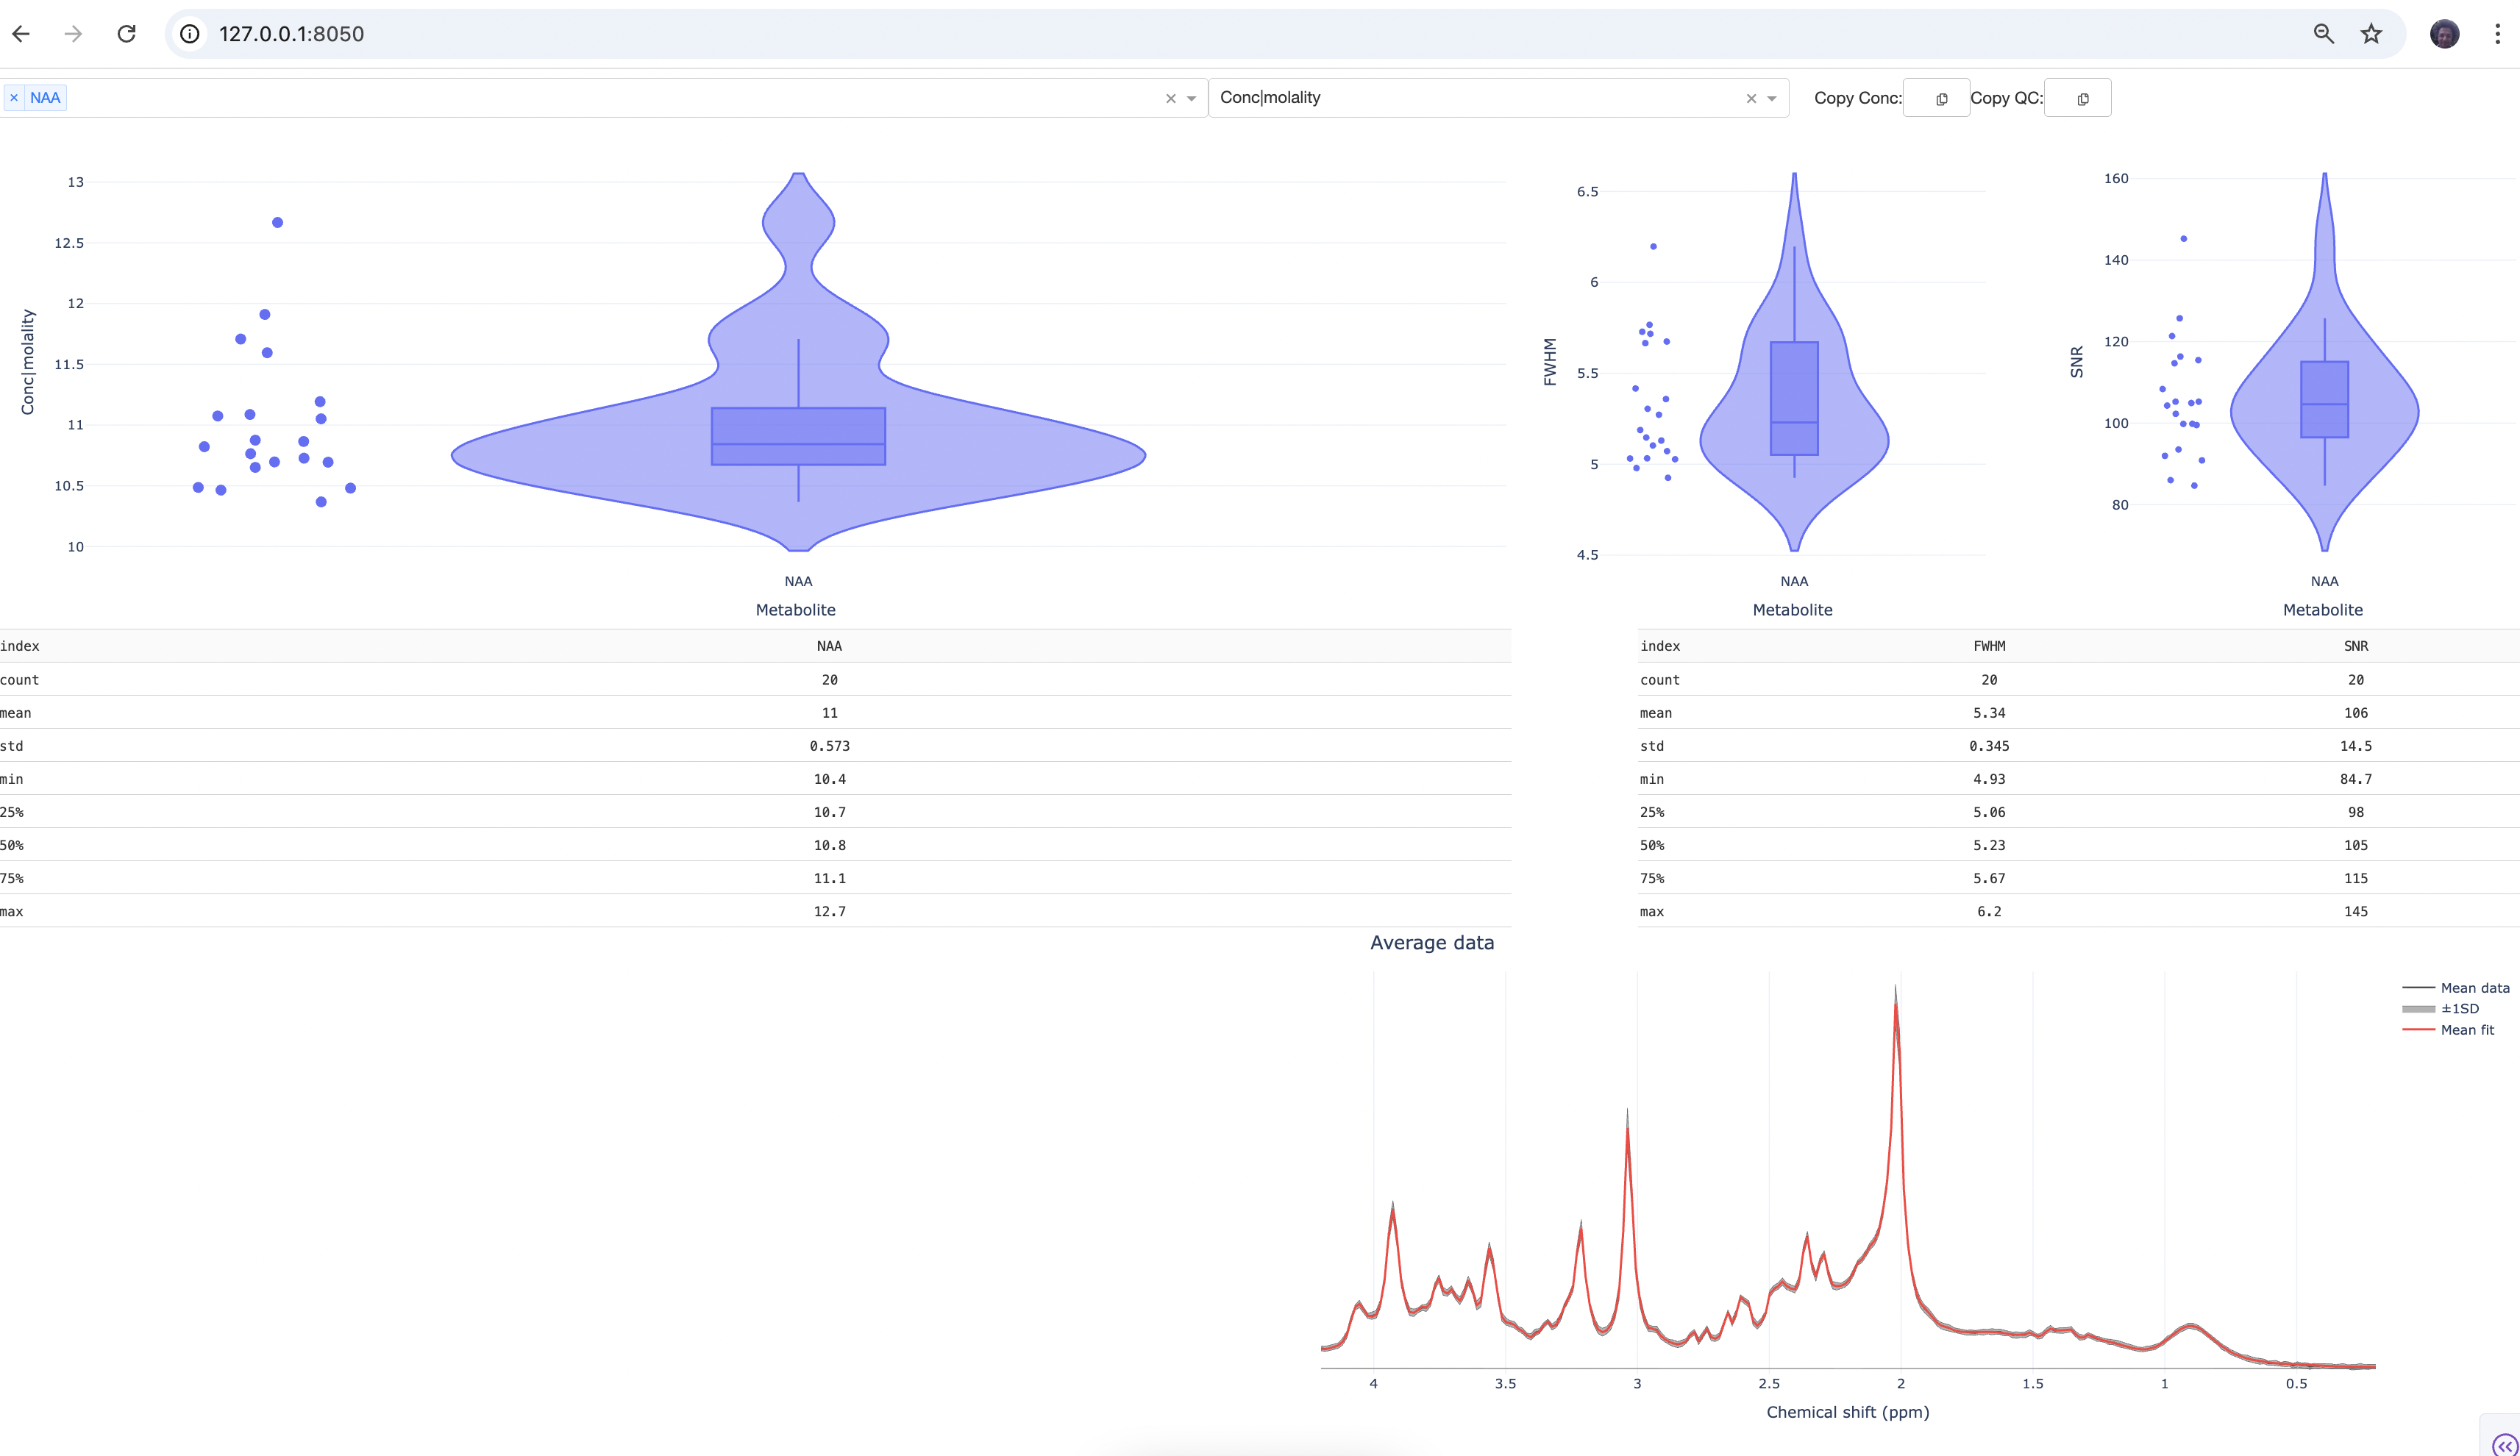
The scatter plots show the results for individual subjects. If you click on one of the dots, you should see the data and model fit for the corresponding subject. You can also load more metabolites either by typing their names or using the drop-down menu. Play around with the interactive plots, compare different metabolite concentrations and QC metrics.
The End!