MRS Fitting Visualisation
This mini practical covers fitting visualisation. As with all these mini-practicals, instructions on how to run FSL commands can be found on the Getting Started page.
This practical requires three datasets. Download and unzip them into your working folder:
SVS data
MRSI data
Multisubject data
- HTML report
- Using the interactive HTML report.
- FSLeyes
- Using the MRS Plugin in FSLeyes.
- Multi-subjects results
- Interactive visualisation of multiple datasets.
HTML report
After fitting, you can look at the results interactively using the html report (provided you have added the --report option in e.g. fsl_mrs).
Let's look at a pre-baked analysis report. Open the report in a web browser:
cd data_ch4_svs
firefox fsl_mrs_quant/report.html
The report should look something like this:
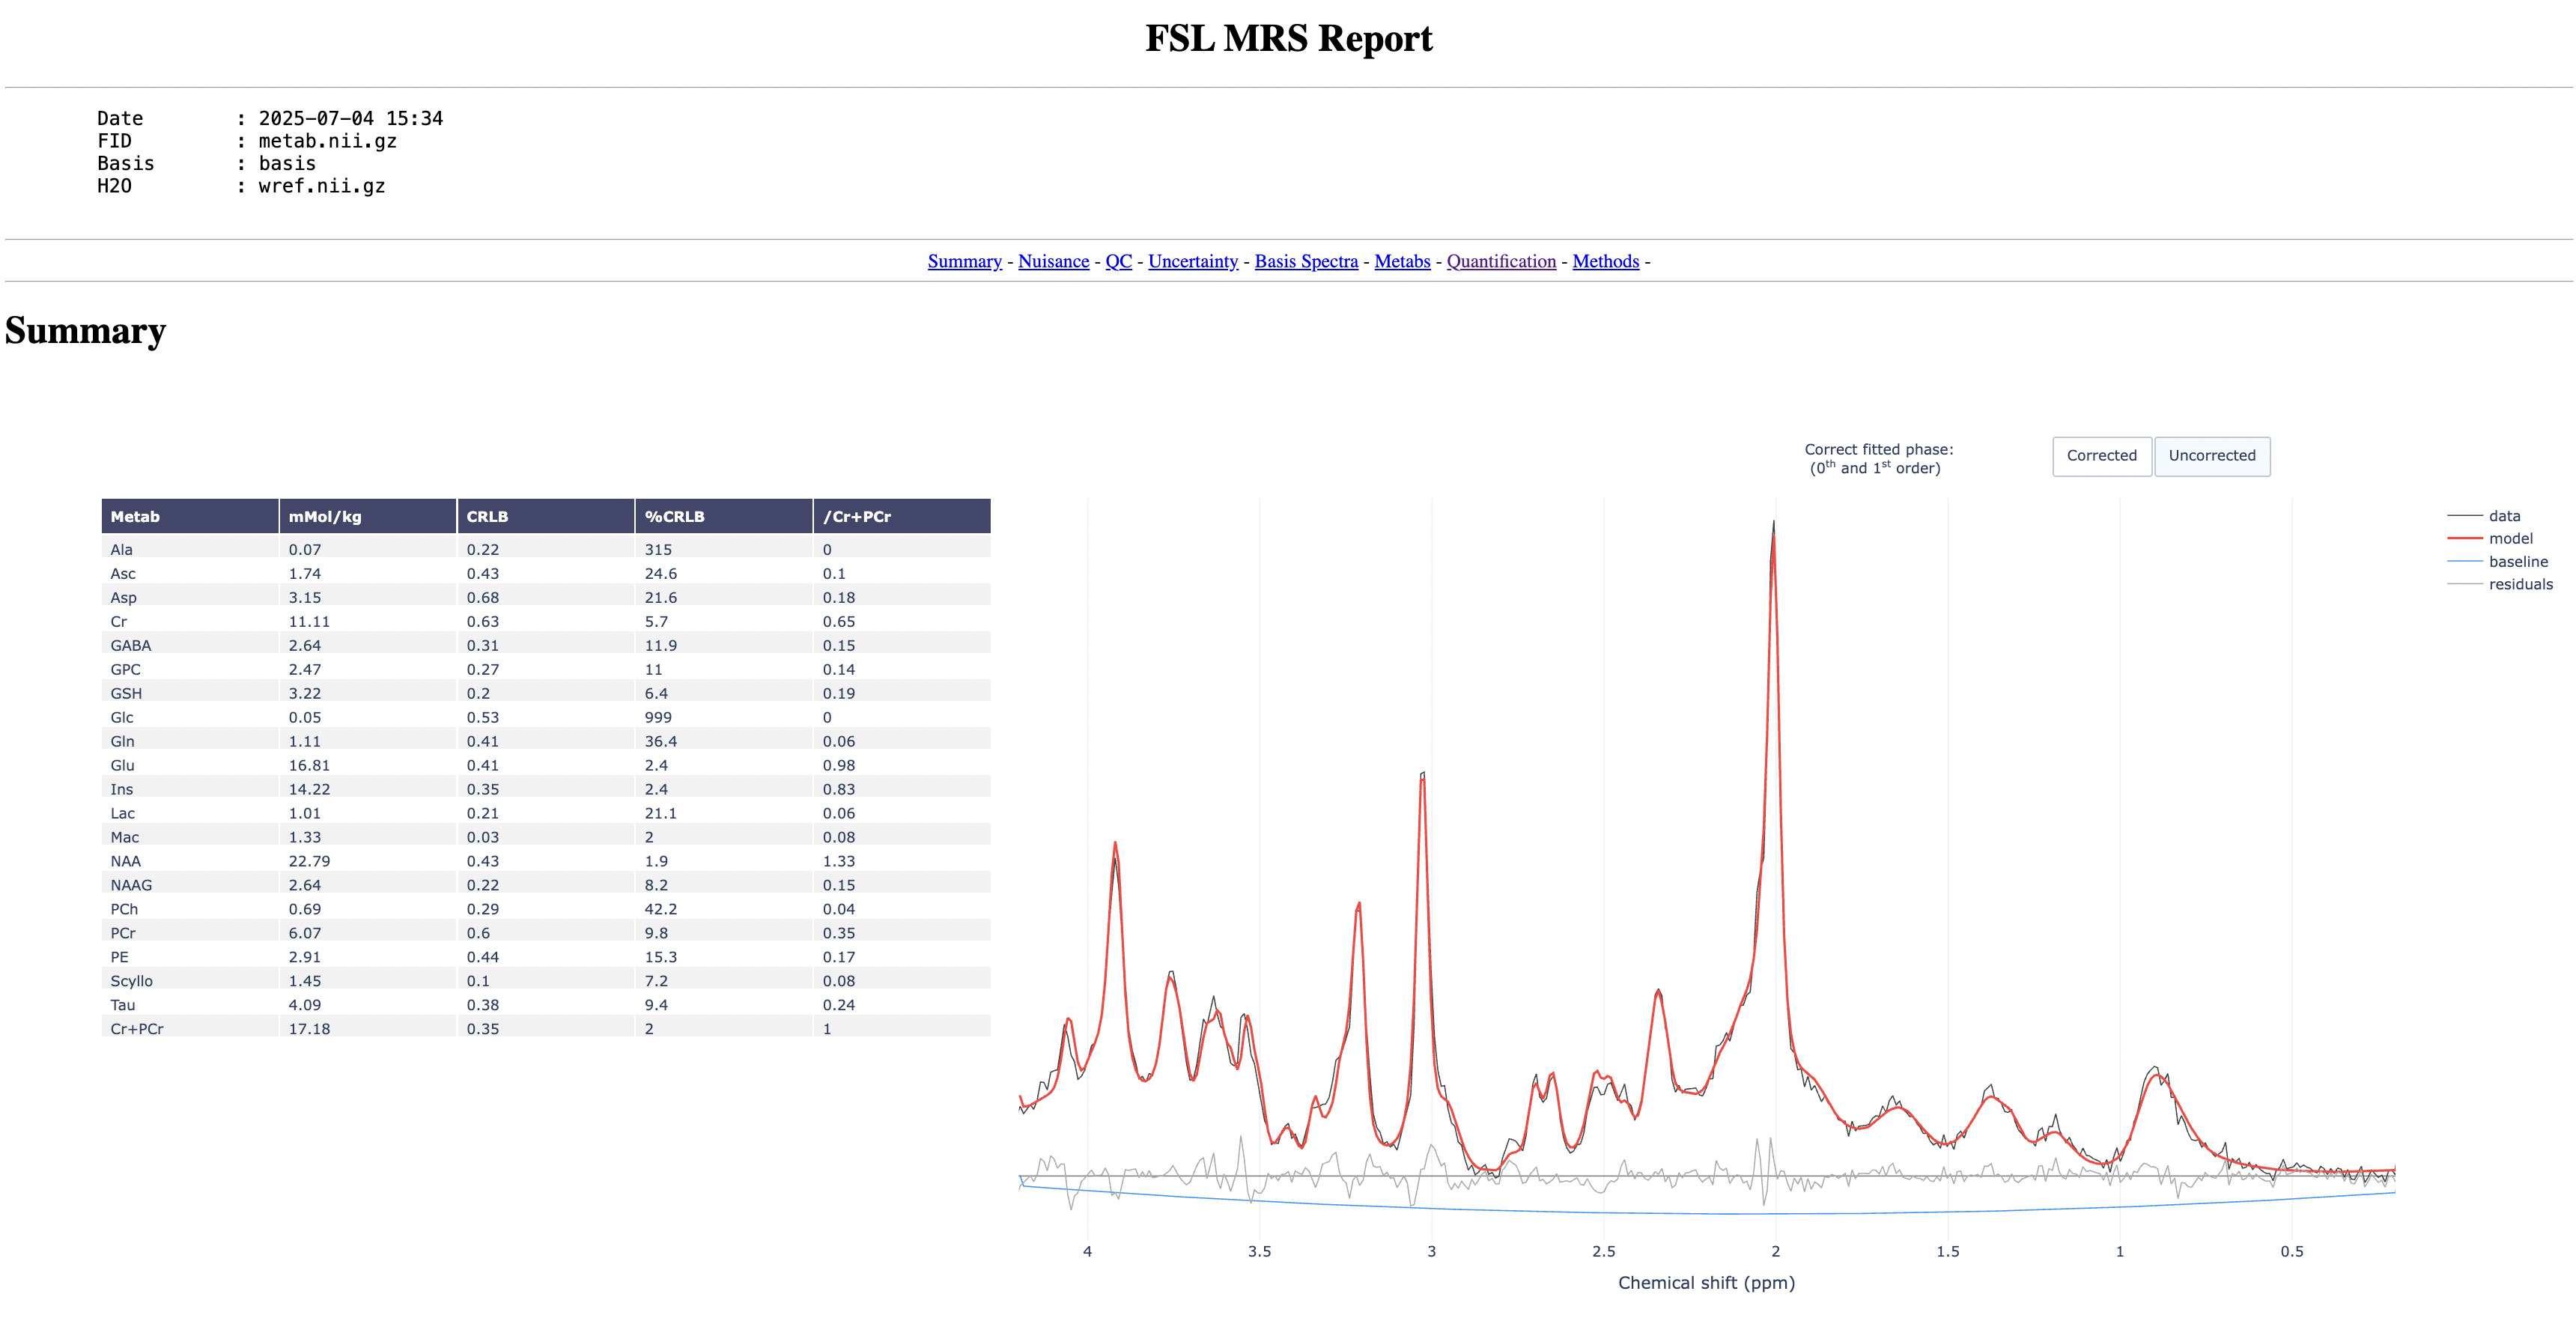
Start by toggling on and off the model to see how well it fits to the data
Now go through the report and try to answer the following questions:
- Which metabolite has the highest concentration?
- Which metabolite has the highest SNR?
- Which pair of metabolites have the highest correlation?
FSLeyes
For more visualisation flexibility, we can load our fitted model onto FSLeyes. Let us first load the data and the T1 image:
fsleyes -smrs T1.nii.gz metab.nii.gz &
Note: the -smrs option tells FSLeyes to use the MRS plugin
In order to load the model prediction, we need to create a NIFTI file that contains the model. We can do this with the command:
results_to_spectrum -f model.nii.gz fsl_mrs_quant
You can now load the file model.nii.gz to FSLeyes and check how well it fits the data.
Using FSLeyes is even more powerful when doing MRSI, where each voxel has its own data and fitted model. The MRS plugin in FSLeyes is able to read a results folder and understand its content. Let us look at an example:
cd data_ch4_mrsi
fsleyes -smrs T1.nii.gz mrsi.nii.gz &
Using the menu bar, select Tools->Load FSL-MRS fit and choose the output folder created
by the fsl_mrsi command (should be fsl_mrsi_out).
Now you should be able to see a new panel called "FSL-MRS Results" where you can choose which results to display - try selecting a metabolite from the list to view a metabolite map. In the "MRS View" panel you should be able to see the model predictions and baseline. Add the data plot by ticking mrsi in the Overlay list of the MRS View panel on the right. You can look at individual voxels by simply clicking through in the Ortho View panel. You should be able to see something like:
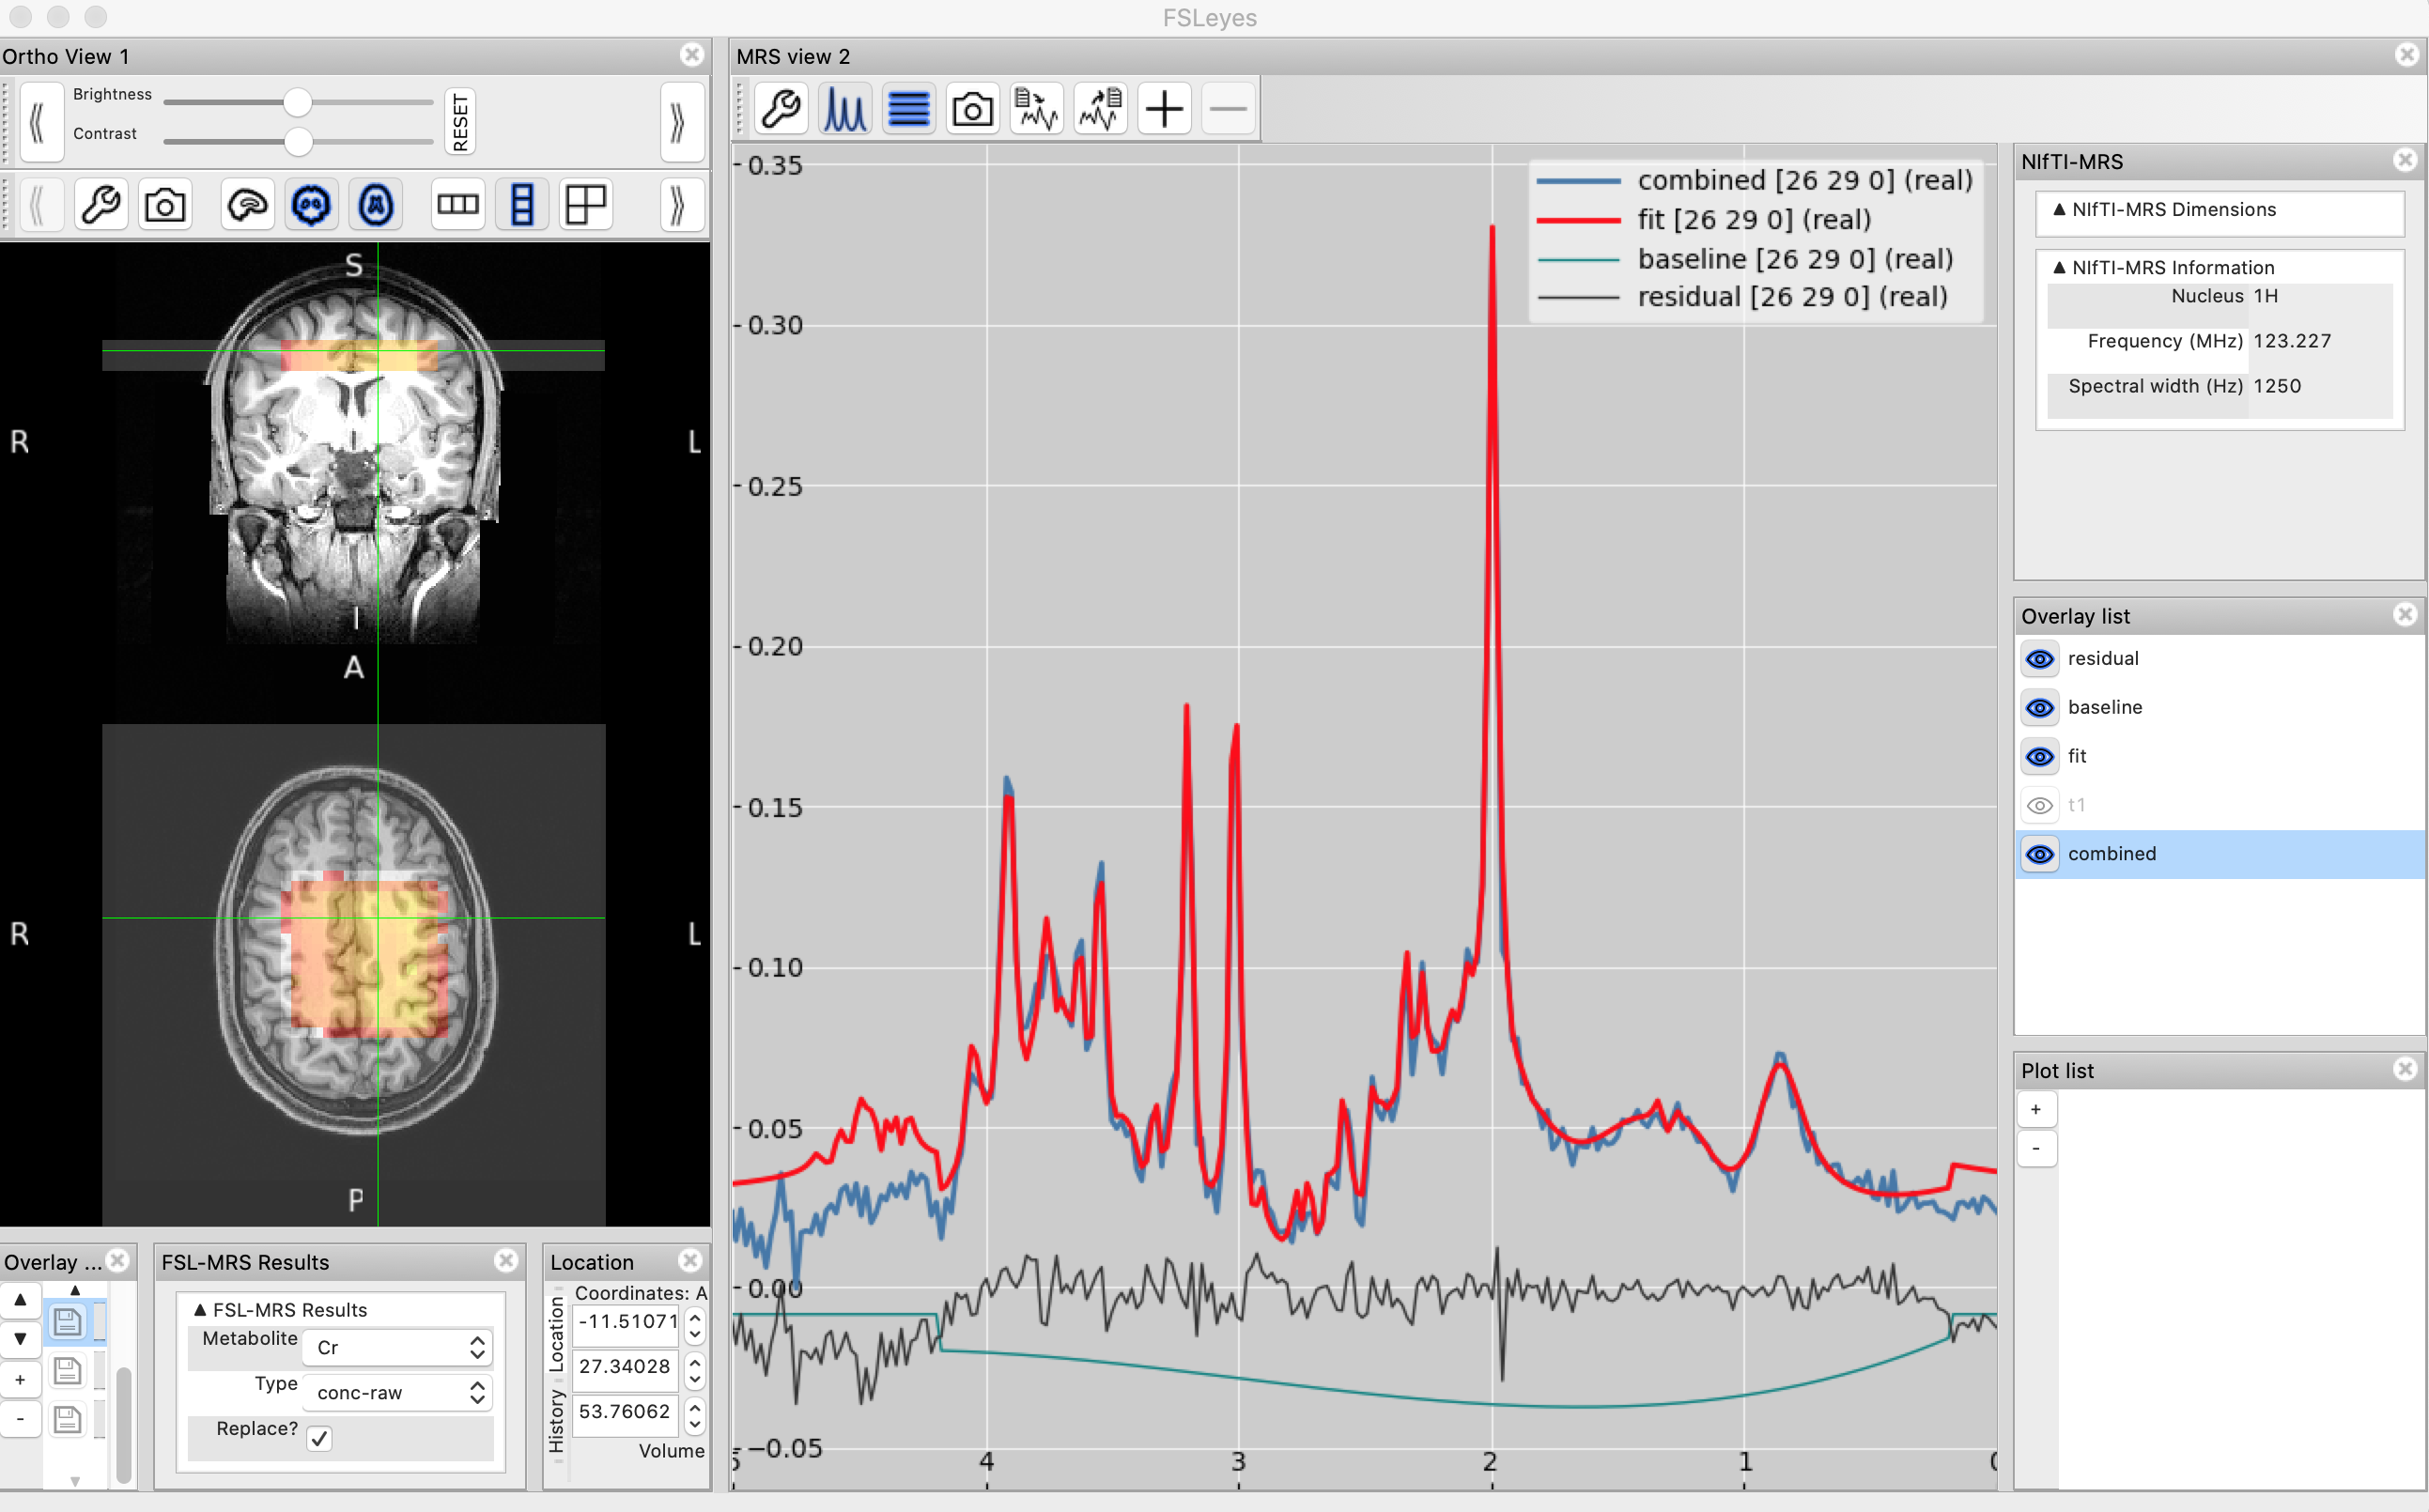
FSLeyes's MRS plugin recognises the different files found in the results folder. You can look at individual metabolite maps (with different types of normalisation/quantitation), you can also look at QC maps (e.g. SNR). Play around and try to familiarise yourself with the output. Compare the fit for high SNR vs low SNR voxels. Compare voxels at the edge of the ROI to voxels in the middle.
Multi-subjects results
After running fsl_mrs on multiple datasets (e.g. subjects), it is not convenient to look at the results using the individual HTML reports. There is a convenient visualisation tool called fsl_mrs_summarise which allows you to quickly go through all the subjects and maybe identify outliers based on their QC or concentration estimates.
Run fsl_mrs_summarise:
cd data_ch4_summarise
fsl_mrs_summarise dir fits
If the browser does not automatically open, copy the http address from the terminal onto your web browser. You should see something like this:
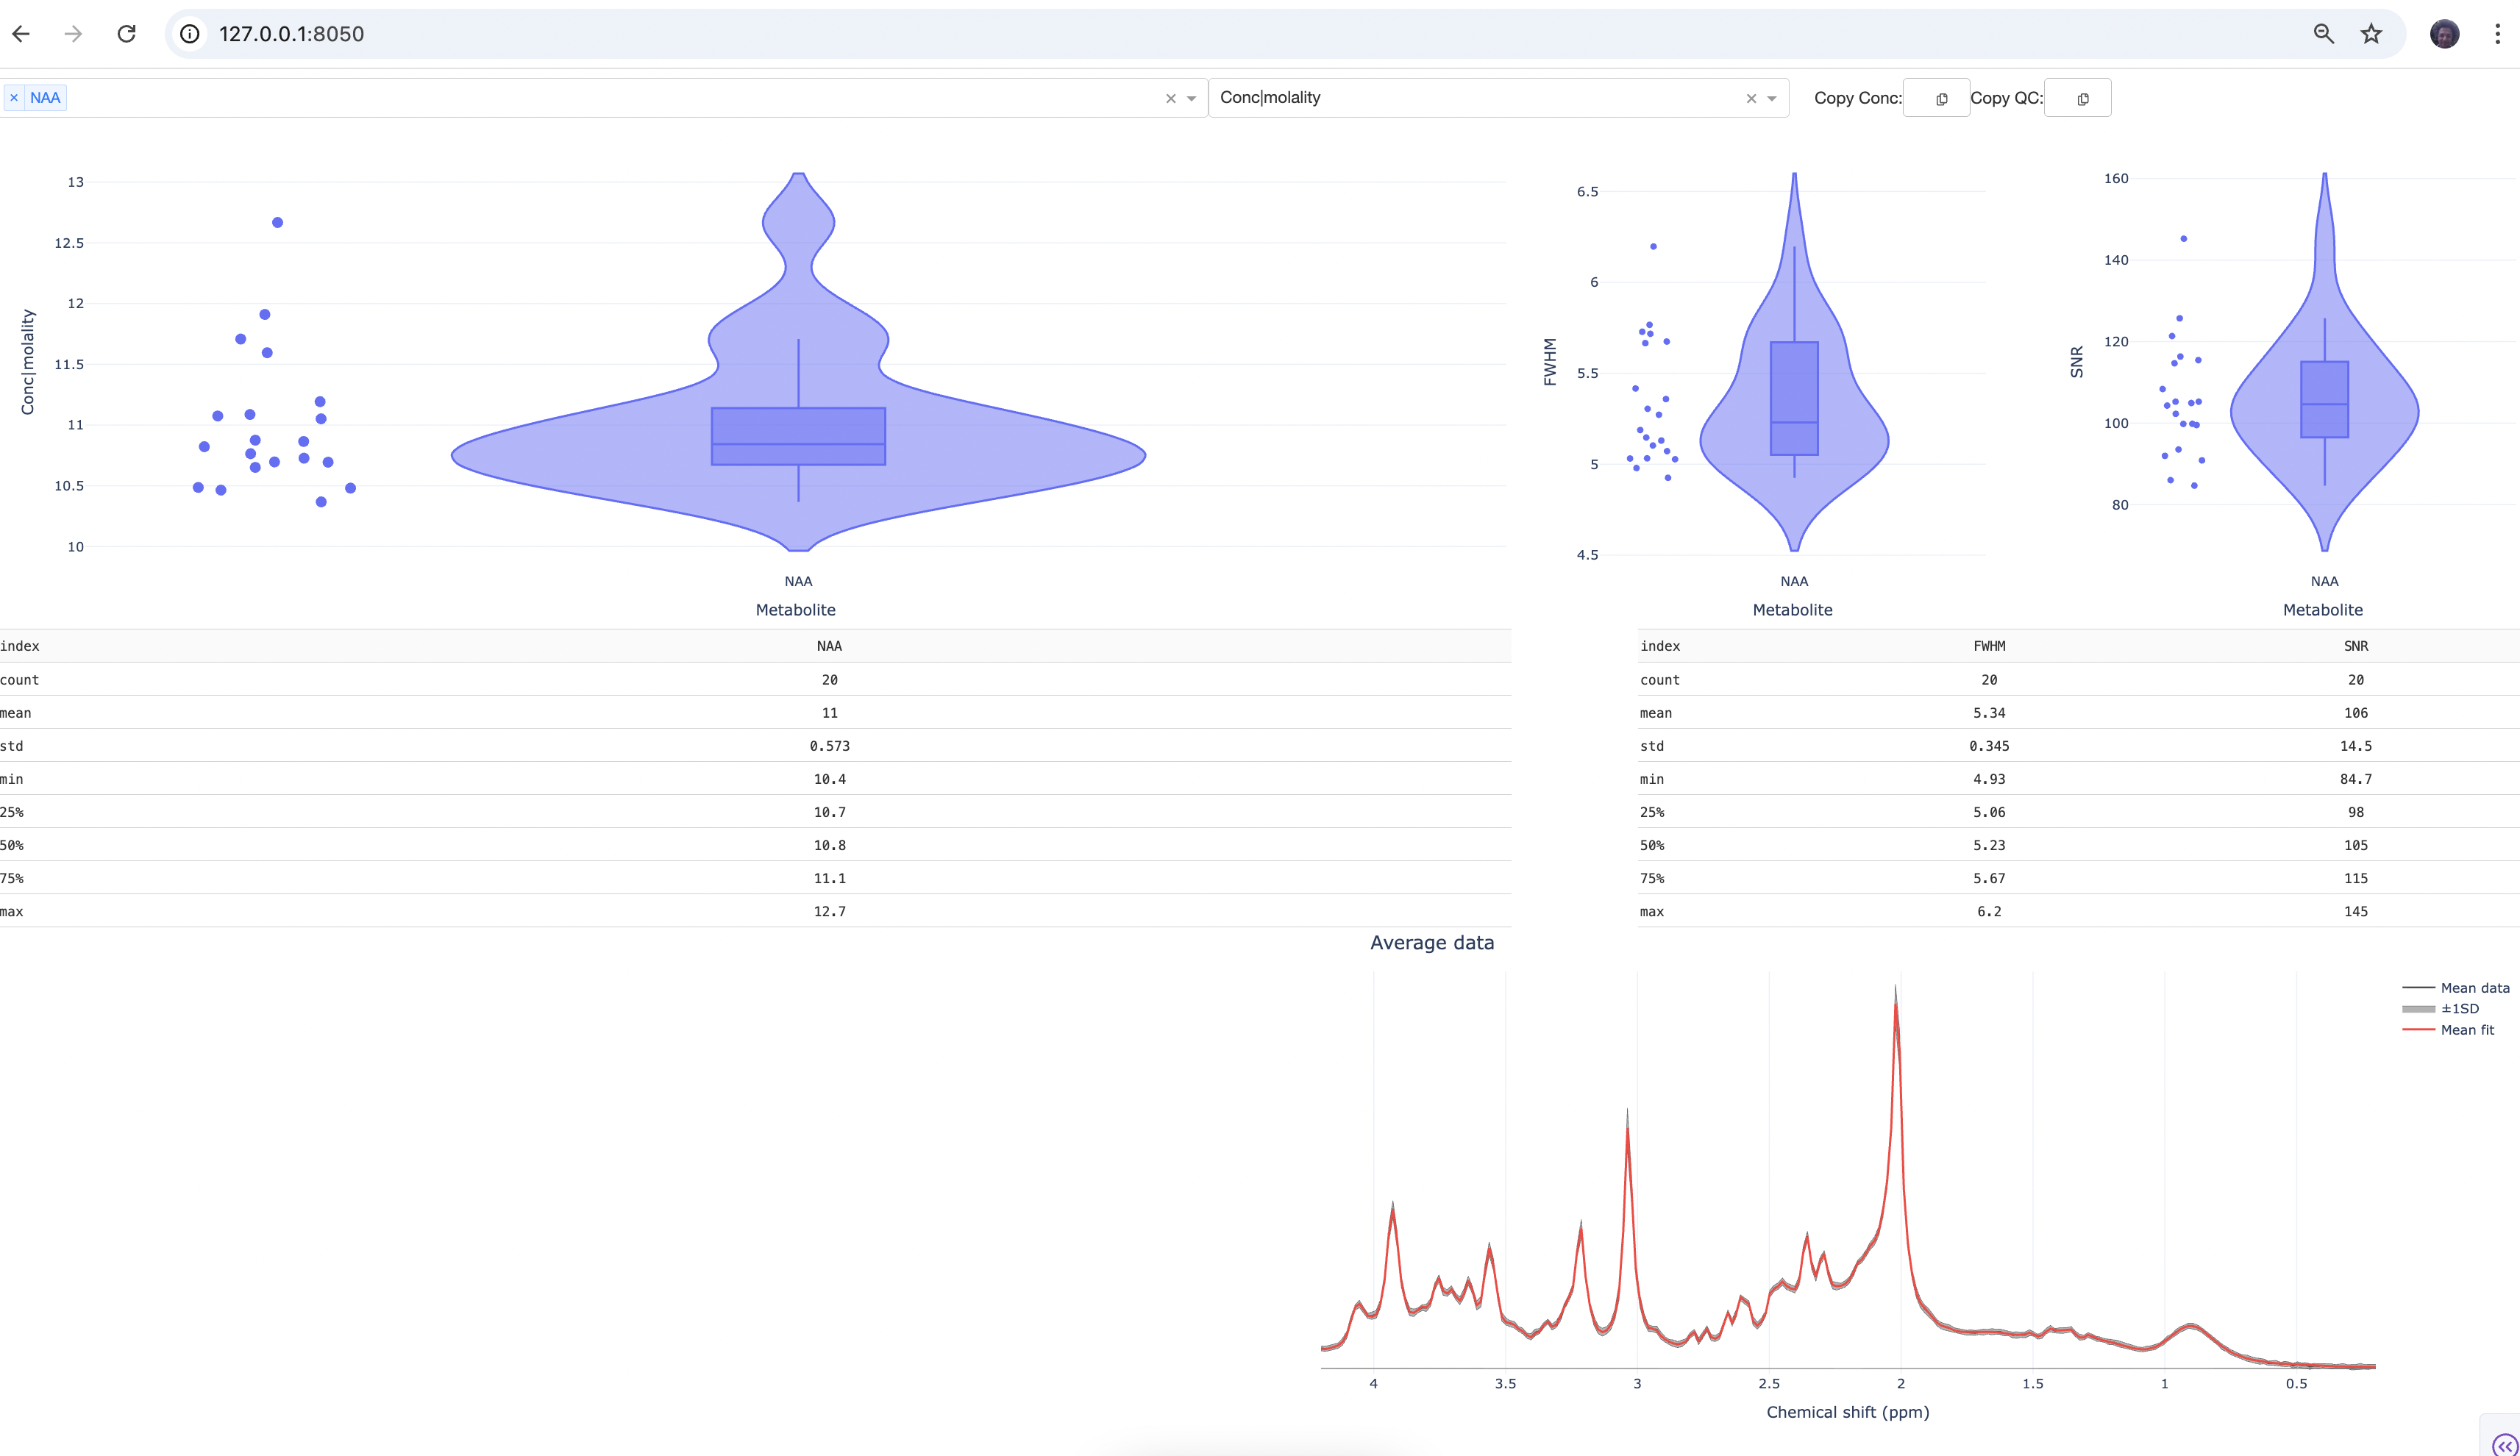
The scatter plots show the results for individual subjects. If you click on one of the dots, you should see the data and model fit for the corresponding subject. You can also load more metabolites either by typing their names or using the drop-down menu. Play around with the interactive plots, compare different metabolite concentrations and QC metrics.
The End!